
In Visual Studio 2015 we’ve introduced two improvements to the C++ debugging experience to address pain points that we’ve heard from you. Improved startup performance when launching applications (F5), and reduced the chance functions called from the Watch or Immediate windows deadlocking.
Improved startup performance on F5
When a process is launched by a native debugger, Windows allocates memory using the debug heap rather than the normal heap. The debug heap has diagnostic aids such as allocation/de-allocation sentinel values and other diagnostic features to help diagnose heap related bugs. This extra checking however comes at a performance cost when allocating memory, and the C Runtime (CRT) has its own heap checking functionality so if your program is using the CRTs functions to allocate memory (e.g. malloc) then the operating system’s isn’t likely to be needed.
So to improve performance when launching C++ applications with the Visual Studio debugger, in Visual Studio 2015 we disable the operating system’s debug heap. If you are really interested in debugging heap related issues using the operating system’s support, you can turn on the capability rather than us turning it on by default for everyone every time they debug.
To enable the operating system’s debug heap, you can override this behavior in one of two ways.
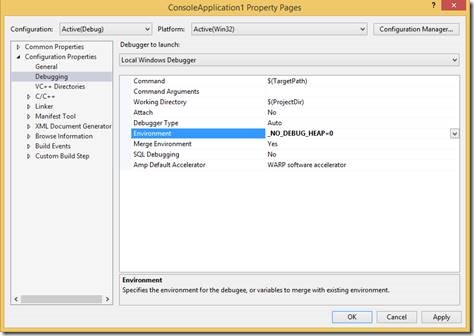
- To modify on a per project basis, open the project properties pages, and select “Configuration Properties -> Debugging” and change the Environment property (a value of 1 enables it, a value of 0 disables it).

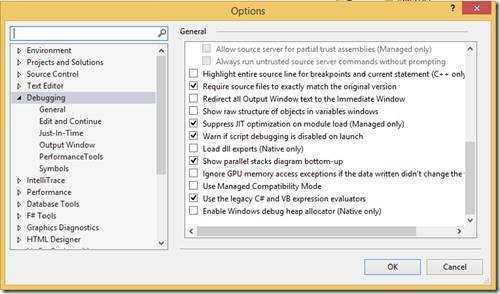
- To modify for every project in Visual Studio, go to Tools -> Options -> Debugging and check the option: “Enable Windows debug heap allocator (Native only)”. Note that if the _NO_DEBUG_HEAP environment variable mentioned in the previous point is set in a project it will always override this global setting.

Reduced chance of deadlocks when evaluating functions
The second improvement we have made is to reduce the risk of a function called from the Watch or Immediate window deadlocking.
If you need to test or debug functionality by calling a function when stopped in the debugger you risk that function deadlocking if the process has more than one thread. Even if your code doesn’t explicitly take locks, if the function allocates any memory it implicitly takes locks during the allocation. This means that if any other thread in the process was in the middle of an allocation when you stopped in the debugger it is now suspended while holding the lock. Normally when a function is evaluated in the debugger that is the only thread in the process that is run, so it will deadlock if it requires another thread to release a lock in order to run to completion.
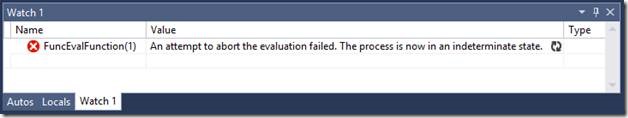
If a deadlock occurs, your debug session is over for all practical purposes. If you made the call from the Watch window the debugger will abort the function call if it takes longer than 10 seconds to complete. Once a function has been aborted however, your program is an unknown state so likely needs to be restarted. To see this in action, download the attached sample and set a breakpoint where the comment indicates. Open the application in Visual Studio 2012 or Visual Studio 2013 and when the breakpoint is hit
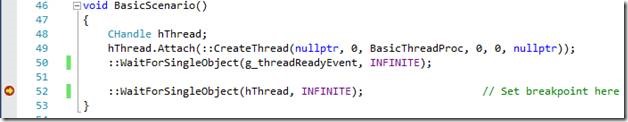
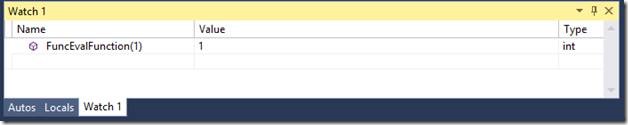
type FuncEvalFunction(1) in the Watch window. You’ll see the mouse spin, and then the timeout occur.
If you typed FuncEvalFunction(1) in the Immediate window, the debugger would wait until the function completed rather than timing out. This is because you can hit breakpoints when calling functions from the Immediate window, so you have to stop debugging to resolve the hang.
With Visual Studio “14” to improve this situation, the debugger uses Window’s Wait Chain Traversal functionality to determine if the evaluated function is deadlocked waiting on another thread to release a lock. If the debugger detects that the thread is deadlocked it will allow all of the threads in the process to run (called thread slipping) until the evaluated function completes. It is important to note that events that would normally cause the debugger to stop (exceptions and breakpoints) are ignored in a thread that is slipping. This means that if you evaluate a function that results in thread slipping, and an exception or breakpoint occurs on a slipped thread then you will not be notified in the debugger and the event will be ignored. The odds of this happening are hopefully low, and should only occur in the case where the function evaluation wasn’t going to be able to complete.
Trying the above evaluation from the Watch window in Visual Studio 2015 results in the function completing (you can try this yourself using the attached project).
Obviously this will only resolve deadlocks in the cases where allowing a different thread to run solves the problem, it cannot avoid deadlocks in other situations, e.g. when the function is waiting for a notification that is never sent.
Conclusion
Try out these new features in Visual Studio 2015 and let us know what you think about them, or any other issues you have debugging C++ code. You can provide feedback below, through the Send a Smile feature in Visual Studio, or in our MSDN forum.
Additionally check out other improvements we’ve made to the debugging experience for all languages (including C++) on the Diagnostics channel on the Visual Studio ALM blog including the improved breakpoint’s experience and PerfTips.
0 comments