It’s been a looong time since I published a detailed look at TFS dogfooding. I used to do them every month but then the server got so big and the reports monotonous enough that I decided to stop. I’ve had a number of queries about it in the past few months, so I figured it was time to do an update.
I’ll start by talking about DevDiv. It’s more complicated than it used to be. We used to just have one TFS server for all of DevDiv and I could report one set of stats. Now we kind of have 3. Let me explain.
In TFS 2010, we introduced Team Project Collections. In many ways a Team Project collection is like a separate TFS server – it’s totally isolated in its own SQL database, etc. When we (developer division) adopted TFS 2010, we decided it was time to “start fresh”. We’d been using the same TFS server since 2004 and as these things do sometimes, it grew lint – gangly organization, extra cruft that no one actually needed, etc. Further, we made some big performance/scale enhancements in 2010 that required database schema updates and making those update to a server as big as ours was was going to take a very long time (many many days). So, we decided to start with a new Team Project collection and then just fault in the stuff that we needed – doing appropriate reorganization as we went – think of it as spring cleaning 🙂 Of course we still keep the old Team Project Collection around and that’s where we do all of our servicing work (service pack, hot fixes, etc) for older versions of VS. However it’s not used nearly as much as the new collection is used (where we are doing our VNext work). That meant we went from 1 –> 2 collections, however, both run on the same hardware so it’s still one TFS server.
The second issue, and I wrote about this some a couple of years ago, was that the DevDiv server had gotten so big and so mission critical that we had grown to be VERY conservative about updating it. Part of dogfooding is being able to use builds that are under development but we got ourselves into the position that we couldn’t any longer due to the fact that we couldn’t risk the service interruption that bugs in intermediate builds might induce. To address this issue, last summer, we set up a new TFS server that we affectionately call “Pioneer”. On this server we have a relatively small portion of the overall DevDiv organization (maybe 350 people) doing their daily work. These teams were chosen for their tolerance for possible disruption – in most cases they are people who directly or indirectly contribute code to TFS feature scenarios and are therefore willing take some risk in order to use the latest features. We update the Pioneer server every few months.
All of this means that when I report DevDiv number, I’ll report them in 3 sets: VS VNext, VS Servicing and Pioneer. Some things, like user count, aren’t mutually exclusive (often the same people use 2 or more of the collections) and this will result in “double counting” if you just add up the numbers. However most things actually can be added to get a total number.
As you look at the numbers, a couple of things to keep in mind.
1) The VS Servicing database was around for a long time. It had many people using it for many years.
2) The Pioneer database has a small subset of teams really working in it – so it’s a fraction of the DevDiv size. Recent users doesn’t accurately reflect the proportion because it doesn’t distinguish between “light users” (someone who looks up a bug) vs heavy users (people doing checkins).
3) Pioneer is running Dev 11 pre-release bits and we have made some changes. For instance, attachment content is now included in the file count.
| Metric | VS VNext | Pioneer | VS Servicing |
| Recent Users | 3,295 | 1,712 | 3,368 |
| Team Projects | 8 | 8 | 75 |
| Files | 371,903,328 | 73,317,059 | 1,052,226,846 |
| Compressed File Sizes (MB) | 1,276,709 | 1,419,324 | 4,915,960 |
| Uncompressed File Sizes (MB) | 5,418,821 | 2,681,084 | 16,319,559 |
| Checkins | 244,683 | 90,290 | 2,165,020 |
| Shelvesets | 55,727 | 35,859 | 284,213 |
| Merge History | 697,220,676 | 107,589,634 | 2,485,529,669 |
| Pending Changes | 16,042,586 | 1,422,410 | 26,931,501 |
| Workspaces | 19,786 | 8,522 | 44,650 |
| Local Copies | 3,129,226,059 | 409,161,527 | 824,218,447 |
| Users with Assigned Work Items | 2,698 | 3,695 | 5,093 |
| Total Work Items | 200,517 | 650,238 | 927,419 |
| Areas & Iterations | 4,493 | 8,014 | 12,092 |
| Work Item Versions | 1,879,382 | 6,842,523 | 8,963,043 |
| Work Item Attachments | 52,542 | 234,074 | 482,249 |
| Work Item Queries | 26,602 | 21,448 | 125,445 |
Here’s a look at the top 10 table sizes for each of the databases:
VS V.Next
| TableName | Size (MB) | % |
| tbl_Content | 1329107.04 | 59.46% |
| tbl_LocalVersion | 602183.99 | 26.94% |
| tbl_Version | 64435.09 | 2.88% |
| tbl_PropertyValue | 48772.83 | 2.18% |
| tbl_VersionedItem | 43774.84 | 1.96% |
| tbl_MergeHistory | 38935.34 | 1.74% |
| tbl_BuildInformationField | 35031.9 | 1.57% |
| Attachments | 22835.96 | 1.02% |
| tbl_BuildInformation | 15014.2 | 0.67% |
| tbl_AttachmentContent | 7601.68 | 0.34% |
VS Servicing
| TableName | Size (MB) | % |
| tbl_Content | 5108682.9 | 73.17% |
| tbl_LocalVersion | 641180.78 | 9.18% |
| Attachments | 489900.24 | 7.02% |
| tbl_Version | 257896.06 | 3.69% |
| tbl_VersionedItem | 149325.45 | 2.14% |
| tbl_MergeHistory | 141534.93 | 2.03% |
| WorkItemsWere | 35543.32 | 0.51% |
| bak_versionsToUpdate | 32940.14 | 0.47% |
| tbl_LabelEntry | 28142.96 | 0.40% |
| tbl_PendingChange | 17959.16 | 0.26% |
Pioneer
| TableName | Size (MB) | % |
| tbl_Content | 1386480.21 | 88.34% |
| Attachments | 51315.64 | 3.27% |
| tbl_LocalVersion | 25392.61 | 1.62% |
| WorkItemsWere | 16901.61 | 1.08% |
| WorkItemLongTexts | 16634.2 | 1.06% |
| tbl_Version | 12103.81 | 0.77% |
| tbl_PropertyValue | 11172.32 | 0.71% |
| tbl_BuildInformationField | 8953.96 | 0.57% |
| tbl_VersionedItem | 8416.38 | 0.54% |
| tbl_MergeHistory | 5811.37 | 0.37% |
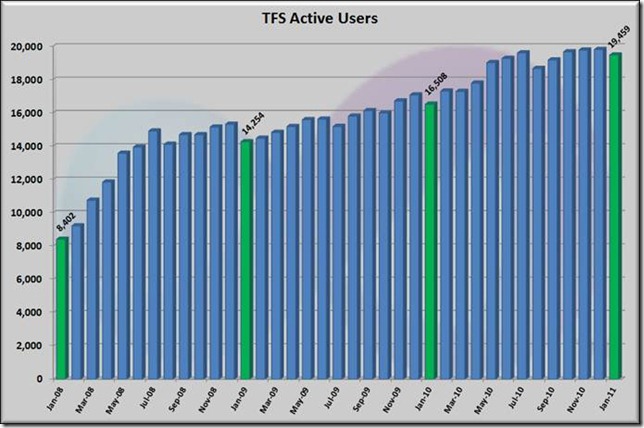
If we step back a bit and look at the broader adoption of TFS within Microsoft, we’ll see that it has continued to trend steadily up.
And here’s a simple tabular form to look at a few key metrics changing in just a few months:
| Service Offering | Oct 2010 | Jan 2011 | Growth |
| Instances | 41 | 42 | +1 |
| Team Project Collections | 100 | 145 | +45 |
| Team Projects | 6,154 | 6,750 | +596 |
| Work Items | 7,843,057 | 8,734,391 | +913,072 |
| Source Code Files | 90,378,237 | 101,486,122 | +11,107,885 |
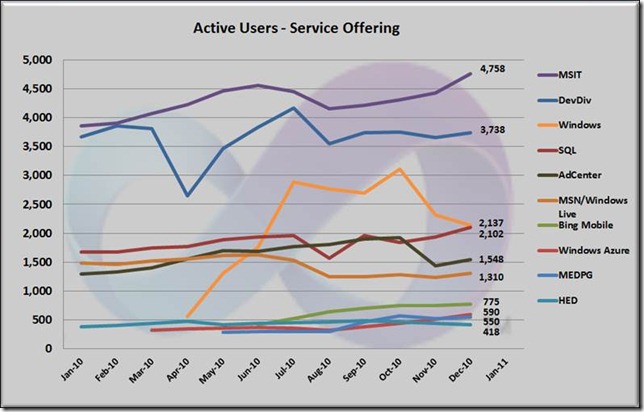
As you can see adoption continues unabated and we are now at about 20,000 active users (people who use it every week) using the system. DevDiv remains the biggest single instance – MSIT is broken across many instances due to the organization of their work. We’re all ready dogfooding V.Next on Pioneer and will be looking to expand that later this year. It’s great to see so many teams and people getting value from TFS.
Brian


0 comments
Be the first to start the discussion.