Over the past couple of years there’s been a growing connection between development and operations. The “old” world where development teams throw applications over the wall at ops is disappearing the same way the world where developers threw applications over the wall at test did. Whether you’re talking about continuous deployment, DevOps or “Build, Measure, Learn”, these are all catchy phrases that are various aspects of getting the development team connected more closely with the customer and with the application in production.
I’ve had the privilege of living this life for the past couple of years as we’ve been bringing the Team Foundation Service to life. It’s really challenged me to think about the world in a different way. Over the next couple of months, I’m going to try to write a series of posts that shares some of the things I’ve been learning along the way. One of those things, though, is that you have to have very good visibility into production. Without it you will have a low quality, expensive, undesirable service. With it you can solve problems before your customers even realize they exist, prioritize work based on what people actually use, test changes to see how it affects user behavior, drive your costs (both hard and soft) to the lowest level possible and much, much more.
In the last year or so, we’ve started to make some significant investments to help with this. The first was the Team Foundation Server and System Center integration we announced about a year ago that enables production tickets to be “escalated” to TFS along with all of the diagnostic information. Another coming in the VS 11 release is Intellitrace in production that allows you to get detailed diagnostic data from your production environment. We’ve also announced some follow on improvements coming to Intellitrace in production that will be available this fall.
Another area we’ve been working is in production telemetry. We’ve partnered with Preemptive (the makers of Dotfuscator) on a basic telemetry included with Team Foundation Server/Visual Studio 11 called PreEmptive Analytics for TFS Community Edition. This built in capability allows you to instrument your application and receive reports from your users on any crashes they experience. The reports are analyzed, correlated with other reports and distilled to a set of “production incidents” that appear to be the same underlying cause. These show up as work items in your Team Foundation Server database. You can also purchase the Pro edition and get additional capabilities like the ability to analyze what features of your application get the most use, etc.
This kind of telemetry has been an important part of our process in Visual Studio for many years. We view it as a critical part of understanding the experience real customers are having, addressing the issues they are having and measuring our progress. We create a number of reports and set goals for every release. For instance, here’s a list of the top 10 crashing bugs in the VS 11 Beta reported by real user telemetry and the current status of the bug.
| Bug Info: | Watson Info: | ||||||
| Rank | TFS ID | Resolution | PU | Hits | CABs | Details | |
| #1 | 358582 | Fixed | VS: Pro | 1010 | 6.0% | 45 | MSENV.DLL!== [Crash32_Normal: 0xC0000005] |
| #2 | 276670 | (Active) | VS: Ultimate | 454 | 2.7% | 9 | VSDEBUG.DLL!CAddressPosition::UpdateMarker [Crash32_Normal: 0xC0000005] |
| #3 | 378926 | (Active) | NDP: WPF | 326 | 1.9% | 42 | NVD3DUM.DLL!unknown [Crash32_Normal: 0xC0000005] |
| #4 | 372955 | (Active) | VS: Pro | 313 | 1.9% | 21 | UNKNOWN.DLL!Microsoft.VisualStudio.Editor.Implementation.Find.FindTarget.CalculateWrapping [Clr20r3: system.nullreferenceexception] |
| #5 | 374532 | Fixed | VS: Ultimate | 226 | 1.3% | 8 | VSDEBUGENG.SCRIPT.DLL!ScriptDM::CProviderEventCallback::AttachToProgramImpl [Crash32_Normal: 0xC0000005] |
| #6 | 362918 | Fixed (excluded) | VS: Pro | 181 | 1.1% | 18 | MSENV.DLL!EnableBrowserSecurityFeatures [Crash32_Normal: 0x C0000420] [Exclude reason: internal only] |
| #7 | 373304 | External (excluded) | VS: Ultimate | 161 | 1.0% | 9 | MICROSOFT.VISUALSTUDIO.ARCHITECTURETOOLS.PROGRESSIVEREVEALPROV!Microsoft.VisualStudio.ArchitectureTools.ProgressiveReveal.ProgressiveRevealProvider.Finalize [Clr20r3: system.missingfieldexception] [Exclude reason: unsupported install] |
| #8 | 378927 | (Active) | VS: Pro | 123 | 0.7% | 12 | MSENV.DLL!CDelayProjectLoadManager::LoadProject [Crash32_Normal: 0xC0000005] |
| #9 | 376355 | Fixed | Expression: VS Integ | 116 | 0.7% | 28 | SYSTEM.RUNTIME.REMOTING.NI.DLL!System.Runtime.Remoting.Channels.Ipc.IpcPort.Read [AppHangB1: 0] |
| #10 | 354401 | (Active) | VS: WinC++ | 113 | 0.7% | 30 | MFC110U.DLL!CView::~CView [Crash32_Normal: 0xC0000374] |
We also create visualizations to show how we are doing overall. Here’s a bar chart – 1 bar for each bug, height indicates number of reports and color is current status of the bug.
So, with VS 11 & TFS 11, you get get the same kinds of telemetry on your applications. Both the server side and client side components for the Community Edition come in the box. The installation for the server side pieces have been integrated to the TFS administration console and the client side pieces are available on the VS tools menu.
In short, you install the server side pieces. Then you instrument your app (including with an url to an exposed server side collector). When customers run your app and experience a crash, it will automatically send data, including things like a stack trace to your server and the aggregation service will file or update bugs on your TFS service.
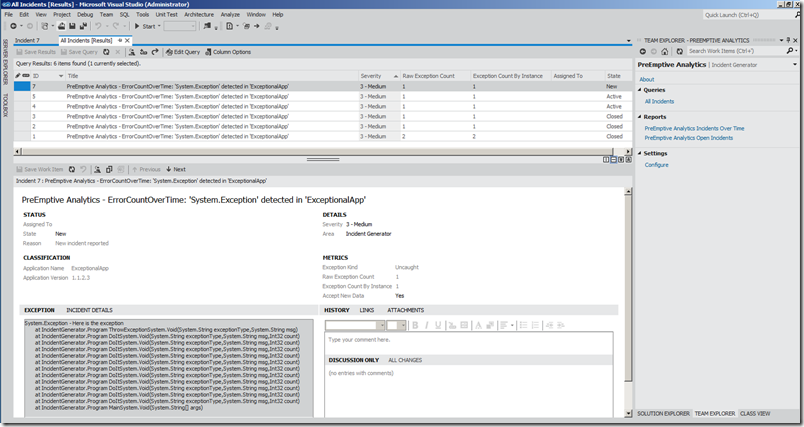
Once you’ve got it all configured and have an app reporting failures, you’ll start seeing production incidents in TFS that look like this:
Then you can start looking at the built in reports like these. Here’s an overview of incidents by application, including the status of the incidents.
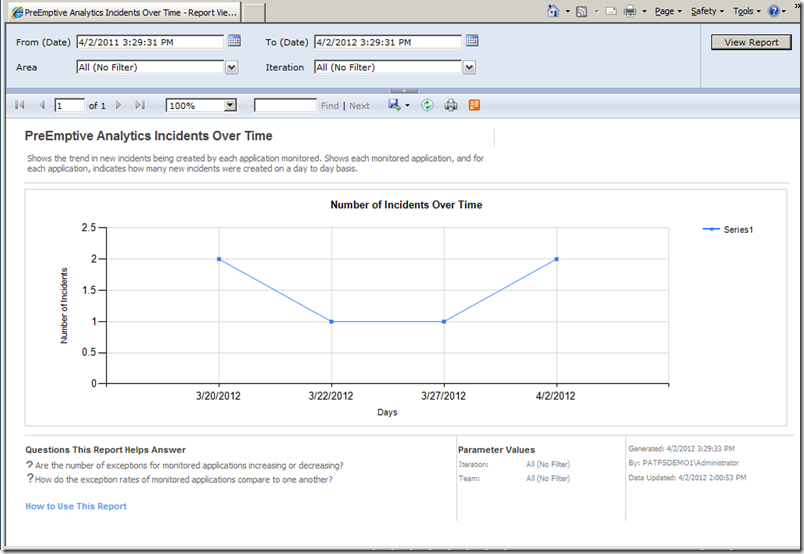
Or trends of incidents over time.
Conclusion
Telemetry and Analytics are increasingly important aspects of the software development process. They enable you to “close the loop” and ensure you are delivering a great experience for your customers. They are important regardless of whether you are building a mission critical server or a client running on desktops in your organization or PCs and phones around the world. For the past several years, we’ve been investing in making Visual Studio a great tool for developers to get good insight into application behavior and you can expect a great deal more in the coming years.
Everything you need is in the VS 11 and TFS 11 beta releases we published last month. We’re still working to streamline and improve some of the experiences but I think it’s starting to get to where we want it to be. I encourage you to check it out.
You can visit these sites to learn more:
Brian


0 comments
Be the first to start the discussion.