
Cloud-hosted apps are often composed of many services that are integrated together in some fashion. For example, processing a single request might involve:
- Calling an Azure Storage service.
- Posting an event to Azure Event Hubs.
- Calling a custom authentication backend.
With an increasing number of moving pieces comes an increasing number of distributed failure points. Distributed tracing helps collect and correlate diagnostics for complex, multi-service apps. It allows you to follow a customer’s request from the browser to all the components of the system.
How OpenTelemetry helps
OpenTelemetry unifies instrumentation, collection, and export of distributed tracing data across languages, clouds, and libraries. Before OpenTelemetry, changing the hosting platform (running locally, self-hosted, Azure, AWS) or tracing solution (Zipkin, Jaeger, Azure Monitor) required switching the distributed tracing library as well. Switching the tracing library involves changing your app’s code. Also, different tracing libraries vary in their supported integrations (instrumentations). For example, one library might support tracing Redis calls but not Azure Table. Another library might support Azure Table but not Redis, and so on.
OpenTelemetry helps by defining common abstractions for instrumentation, collection, and exporting. When switching your tracing solution to OpenTelemetry, only the exporter plugin needs to change. Your app’s code and third-party library integrations are unaffected.
OpenTelemetry support in the Azure SDK for .NET
OpenTelemetry support means that calls made using Azure SDK libraries would appear in your distributed traces. Azure SDK libraries produce the following kinds of telemetry spans:
- HTTP calls: Every HTTP call that originates from an Azure SDK library.
- Client method calls: For example,
BlobClient.DownloadToorSecretClient.StartDeleteSecret. - Messaging events: Event Hubs and Service Bus message creation is traced and correlated with its sending, receiving, and processing.
For more detailed distributed tracing conventions, see the specification.
At the time of writing, OpenTelemetry support in the Azure SDK for .NET is experimental. For information on when OpenTelemetry support will be officially released, see the Azure SDK releases page. While the OpenTelemetry SDK for .NET is stable, many tracing conventions that describe the shape of telemetry spans are still experimental. Because OpenTelemetry support is experimental, the shape of spans may change in the future. You can follow changes at the Azure.Core changelog. These changes might impact:
- The kinds of operations that are tracked.
- Relationships between telemetry spans.
- Attributes attached to telemetry spans.
Get started
To start collecting telemetry, complete the following steps:
-
Enable OpenTelemetry support via one of the following ways:
-
Set the
AZURE_EXPERIMENTAL_ENABLE_ACTIVITY_SOURCEenvironment variable totrue. -
Set the
Azure.Experimental.EnableActivitySourcecontext switch totruein your app’s code:AppContext.SetSwitch("Azure.Experimental.EnableActivitySource", true); -
Add the
RuntimeHostConfigurationOptionsetting to your project file:<ItemGroup> <RuntimeHostConfigurationOption Include="Azure.Experimental.EnableActivitySource" Value="true" /> </ItemGroup>
-
-
Install the OpenTelemetry package with the following .NET CLI command:
dotnet package OpenTelemetry -
Install one of the exporter packages. To use the preview Azure Monitor/Application Insights exporter, run the following .NET CLI command:
dotnet add package Azure.Monitor.OpenTelemetry.Exporter --version 1.0.0-beta.2 -
Create an Application Insights resource to store the data. Follow the create new resource tutorial and copy the connection string.
-
Configure OpenTelemetry to collect traces and export them to Application Insights:
using var openTelemetry = Sdk.CreateTracerProviderBuilder() .AddSource("Azure.*") // Collect all traces from Azure SDKs .AddAzureMonitorTraceExporter(options => options.ConnectionString = "<Application Insights connection string>") // Export traces to Azure Monitor .Build(); // Start listening -
Add some code making an Azure SDK call. When put together, your code should look something like this:
AppContext.SetSwitch("Azure.Experimental.EnableActivitySource", true); using var openTelemetry = Sdk.CreateTracerProviderBuilder() .AddSource("Azure.*") .AddAzureMonitorTraceExporter(options => options.ConnectionString = "<Application Insights connection string>") .Build(); new BlobClient(new Uri("https://aka.ms/bloburl")).DownloadTo("hello.jpg"); -
Run your app. It takes up to 5 minutes for data to propagate and become accessible through the Azure portal.
-
View your traces in the Azure portal by navigating to Transaction search on the left for your Application Insights resource. Select See all data in the last 24 hours.
The following screenshot shows a sample trace collected using OpenTelemetry and displayed in the Azure portal:
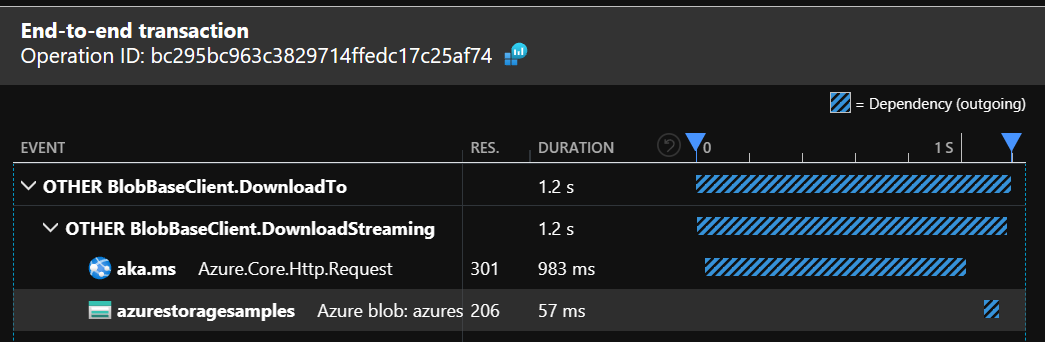
Only packages prefixed with Azure. and released after October 1, 2021 have OpenTelemetry support. Earlier packages support only the ApplicationInsights SDK.
We hope you’ll try the new tracing integration and are eager to hear your feedback.
How can we verify these are working in Visual Studio?
I’m on Visual Studio 2022, newest version, but I don’t see these new Metrics appearing in ‘Application Insights’ search. With the AppInsight’s SDK I could always view and tweak my metrics / traces and view them right at Debug time in Visual Studio in the Application Insight Panel.
I haven’t found an analog to view this info yet directly in Visual Studio. Perhaps if it isn’t on the road map yet, this would be a great feature 🙂 🦃🦃
Unfortunately, the current implementation of Azure Monitor exporter doesn’t have Visual Studio integration yet. Filed https://github.com/Azure/azure-sdk-for-net/issues/25498
Presumably if we want to collect telemetry from calling CosmosDB or blob storage and export to some provider other than Application Insights we only need to complete step one?
Step1 alone won’t be sufficient. You’ll need to replace AddAzureMonitorTraceExporter with something else, like AddConsoleExporter, AddOtlpExporter etc