
Distributed applications are complex and bring in their own set of challenges for developers to debug and fix production issues. Though the microservices architecture helps maintain a smaller team that works autonomously and focuses on separate business domains, it introduces newer challenges due to its distributed nature. For example, in case of an issue during a business transaction, the request needs to be traced end-to-end, which may span across multiple services and infrastructure. Some of the challenges include:
- Managing known and unknown failures
- Failures are also distributed
- Legacy monitoring systems will not work
This is where monitoring and observability come into the picture. While monitoring records the overall health of an application while observability helps you dig deeper with contextual data. During the entire month of March, we focused on bringing you newer content around Microservices. On the .NET show, Cecil and I talked in-depth about the Observability and Monitoring in a Cloud-Native app.
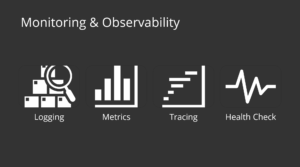
We looked at Observability and Monitoring’s key pillars like Logging, Metrics, and Tracing and deep-dived into the Health checks in the above video.
Here are some of the fundamental concepts discussed in the video:
Health checks
Health checks are implemented in microservices, preferably using HTTP endpoints that various real-time monitoring systems can query. At a very minimum, the health check endpoints should respond to:
- Is the system running?
- Can it perform tasks?
In the Kubernetes world, these directly transform into the liveness and readiness probes, respectively. They are defined in the deployment configuration of the Kubernetes YAML file.

- A liveness path is an endpoint that Kubernetes queries periodically to check for failures. Kubernetes provides liveness probes to detect failing applications and restarts them when they don’t return success codes.
- A readiness path is an endpoint that Kubernetes queries to know when a service is ready to start accepting traffic. It returns the HTTP status code 200 when all registered checks are successful.
ASP.NET Core offers Health checks, middleware, and libraries for reporting health to a monitoring system. To get started, check out Health checks in ASP.NET Core.
Logging
No matter what tools you utilize to investigate issues in production, in the end, it is always the logs that give you the root cause of the problem. In the distributed world, you need to ensure that the log records have in-depth information to debug. They’re queryable from a central place. Each log record needs to have a correlation id, so they’re tracked in a single transaction to get the big picture.
Structured Logging
Using structured logging, you can add serialized objects to the logs that are efficiently queryable by log monitoring systems. For e.g., you can query the entire transaction log based on a customerID or a transactionID. In ASP.NET Core apps, you can use Serilog, which provides structured logging. Checkout Logging in .NET Core and ASP.NET Core for getting started and Serilog to understand structured logging.
Centralized Logging & correlation ID
In traditional applications, log files are stored on the local machine. Logging to a flat-file on a single machine is not helpful in a distributed environment. Applications producing logs may not have access to the local disk, or the local disk may be highly transient as containers are moved around virtual machines. Because of the challenges associated with using file-based logs in cloud-native apps, centralized logs are preferred. Logs are collected by the applications and shipped to a central logging application which indexes and stores the logs. This class of systems can ingest tens of gigabytes of logs every day. Serilog provides sinks for writing log events to centralized systems like Azure Application Insights, a feature of Azure Monitor. It’s also helpful to follow some standard practices when building logging that spans many services. For instance, generating a correlation ID at the start of a transaction and then logging it in each message related to that transaction makes it easier to search for all related messages from the centralized logging systems.
Distributed Tracing
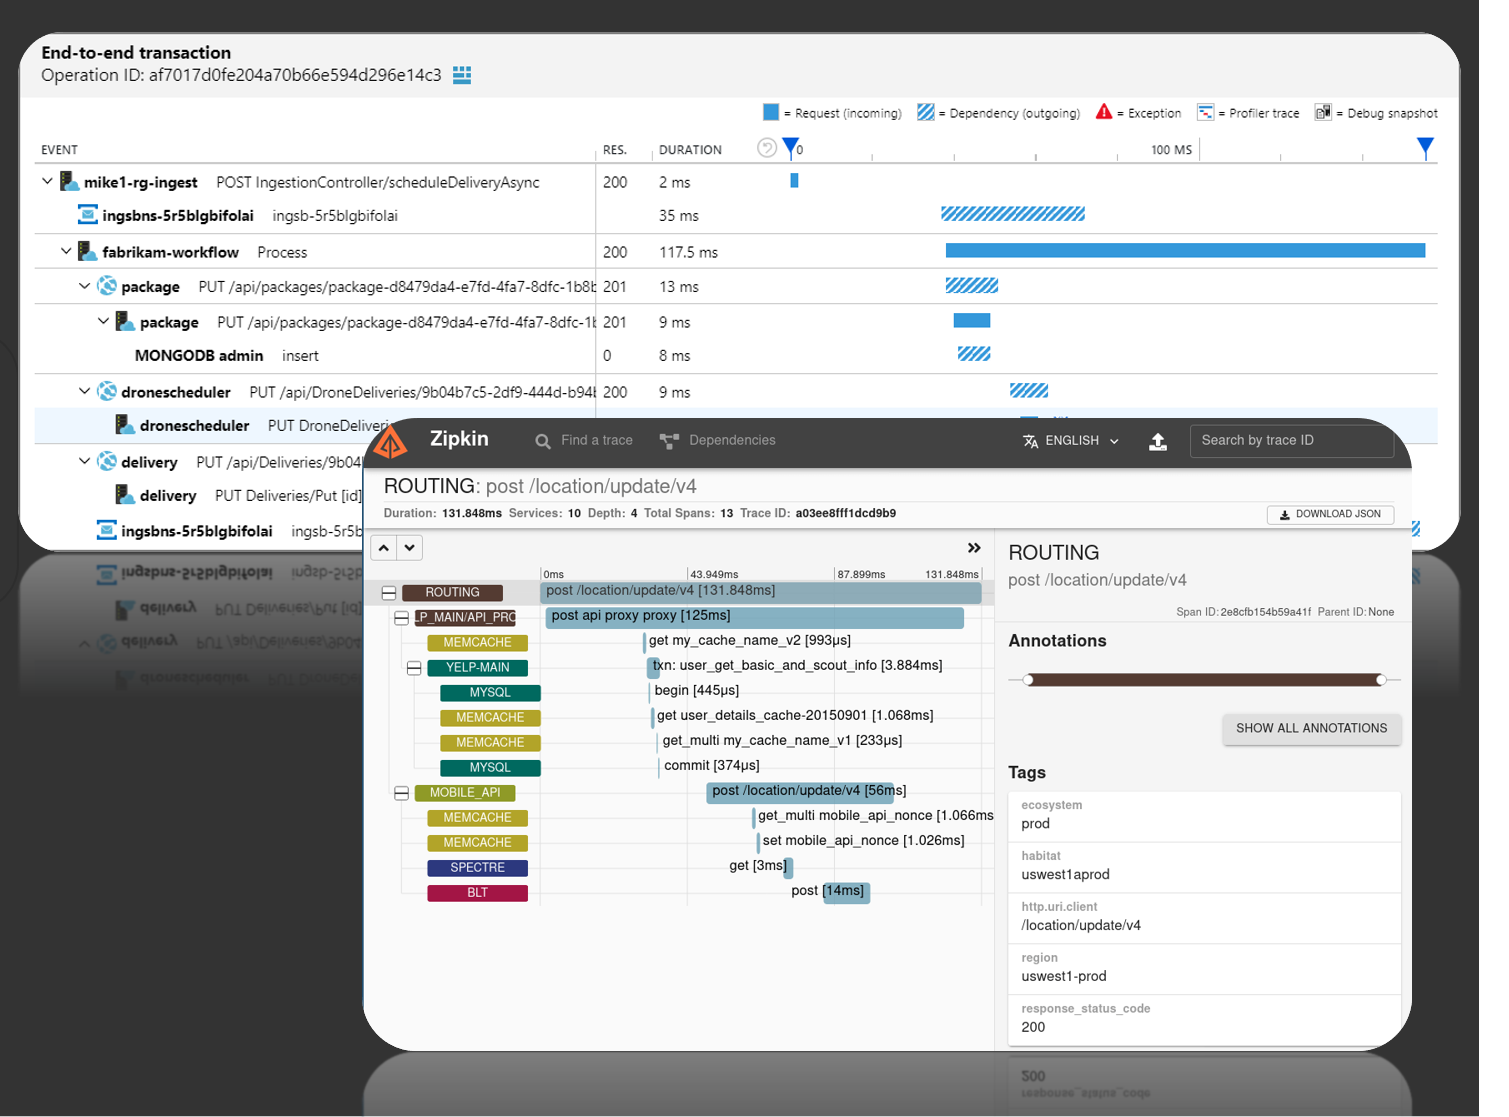
Distributed tracing is the equivalent of call stacks for modern cloud and microservices architectures, with the addition of a performance profiler tossed in. Distributed tracing or distributed request tracing helps look at the request end-to-end and enables you to identify a problem holistically. Trace can give you detailed answers to questions like What time did the event happen? How long did it take? Why did it take so long? What microservice handled it? Etc. Open-source distributed tracing systems like the openzipkin/zipkin are prevalent in this space.
Enabling distributed tracing in your app could be as simple as adding a corresponding distributed trace provider’s SDK into every microservice. E.g., With the Application Insights SDK installed and configured in your app, tracing information is automatically collected for popular frameworks, libraries, and technologies by SDK dependency auto-collectors.
There is a need for standardization with several different systems and tooling in place for observability. OpenTelemetry standardizes how different applications and frameworks collect and emit observability telemetry. OpenTelemetry provides a vendor-neutral specification, a set of APIs, SDKs and tooling and integration for observability telemetry (distributed tracing, metrics, etc.). Check out the blog post OpenTelemetry .NET reaches v1.0 for detailed insights.
Hands-on Modules
We have built a series of modules to help you learn to build .NET microservices and cloud-native technologies. Check out the below modules that will help you understand monitoring and observability.
- For health-checks check out Create and deploy a cloud-native ASP.NET Core microservice
- For monitoring and Observability, check out Instrument a cloud-native ASP.NET Core microservice
- For other topics checkout https://aka.ms/aspnet-microservices
I recently started a blog series about Open Telemetry if you’re new to it.
Any information on how to centralize crash dumps from ASP.NET Core applications in a distributed environment?. The article is clear on logs centralization and distributed tracing, but we need a solution to collect crash dumps when something goes wrong with the runtime, for example when a stack overflow exception happens and the application crashes, generating a crash dump in one of the volatile production vms.
Few weeks ago we recorder a webinar showing how to troubleshoot microservice apps and automated tests. Maybe it will be inspiring for your case: https://info.revdebug.com/march-webinar
We also asked one of the Solution Architect from Microsoft to share more practical examples of how you could use Azure Functions and set up distributed tracing for it. We will run it as a free live webinar on the 29th of April and later share it as a recording. More here: https://info.revdebug.com/azure-serverless-tracing-webinar