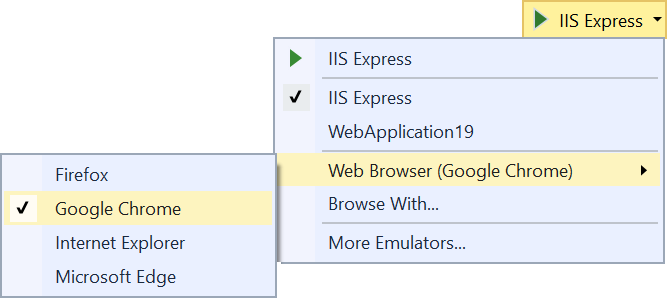
Updated 2017/1/3 – Setting to control script debugging added. See below. Visual Studio 2017 RC now supports client-side debugging of both JavaScript and TypeScript in Google Chrome. For years, it has been possible to debug both the backend .NET code and the client-side JavaScript code running in Internet Explorer at the same time. Unfortunately, the capability was limited solely to Internet Explorer. In Visual Studio 2017 RC that changes. You can now debug both JavaScript and TypeScript directly in Visual Studio when using Google Chrome as your browser of choice. All you should do is to select Chrome as your browser in Visual Studio and hit F5 to debug. If you’re interested in giving us feedback on future features and ideas before we ship them, join our community.  The first thing you’ll notice when launching Chrome by hitting F5 in Visual Studio is a page that says, “Please wait while we attach…”.
  What happens is that Visual Studio is attaching to Chrome using the remote debugging protocol and then redirects to the ASP.NET project URL (something like http://localhost:12345) after it attaches. After the attach is complete, the “Please wait while we attach…” message remains visible while the ASP.NET site starts up where normally you’d see a blank browser during this time. Once the debugger is attached, script debugging is now enabled for all JavaScript files in the project as well as all TypeScript files if there is source map information available. Here’s a screen shot of a breakpoint being hit in a TypeScript file.
  For TypeScript debugging you need to instruct the compiler to produce a .map file. You can do that by placing a tsconfig.json file in the root of your project and specify the a few properties, like so:
{
  "compileOnSave": true,
  "compilerOptions": {
    "sourceMap": true
  }
}
If you prefer to use Chrome’s or IE’s own dev tools to do client-side debugging, the
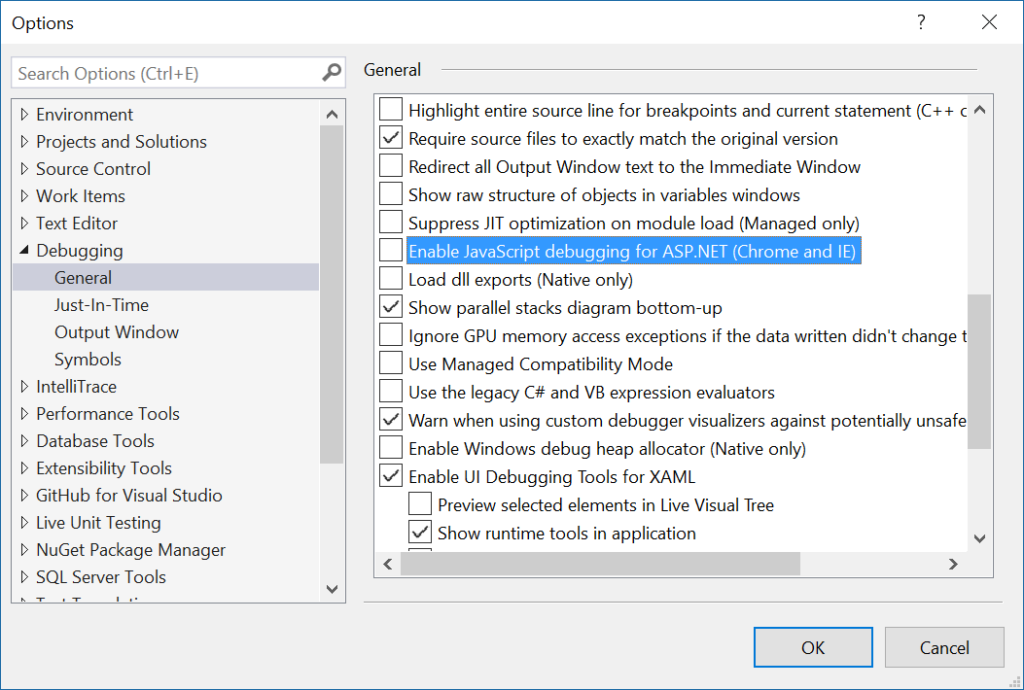
recent update to Visual Studio 2017 RC introduced a setting to disable the IE and Chrome script debugger (this will also prevent Chrome/IE from closing after a debugging session ends). Go to Tools -> Options -> Debugging -> General and turn off the setting Enable JavaScript Debugging for ASP.NET (Chrome and IE).  We hope you’ll enjoy this feature and we would love to hear your feedback in the comments section below, or via Twitter. Download Visual Studio 2017 RC

I have solution with WebApi and angular app where some time ago I had worked debugging my typescript files launching in Chrome. But long time I didn’t use it. Now I need it, but debugging doesn’t working. I have warning message on breakpoints: “The breakpoint will not currently be hit. Breakpoint set but not yet bound”. How to restore debugging?
Nice post! What about debugging on 2019? I tried this approach (above) and it doesn’t seem to work on 2019. Thoughts?
Thanks for the great articles.
Thank you Mads, Its helpful for me .. !!! #happy_coding