This is a guest post from Aloïs Deniel. Aloïs works at Orange Applications for Business as a Xamarin consultant. You can find him on Twitter at @aloisdeniel and on Github at @aloisdeniel.
Displaying charts in mobile apps has always been a great way to offer users a clear overview of numerical data. In my time as a developer, I wanted this task to be as easy as writing a few lines of code, but I couldn’t find a straight-forward way to achieve this, which is why I started exploring SkiaSharp and created Microcharts. Microcharts is a selection of common charts that are easy to use, visually pleasing, and built with cross-platform compatibility in mind.
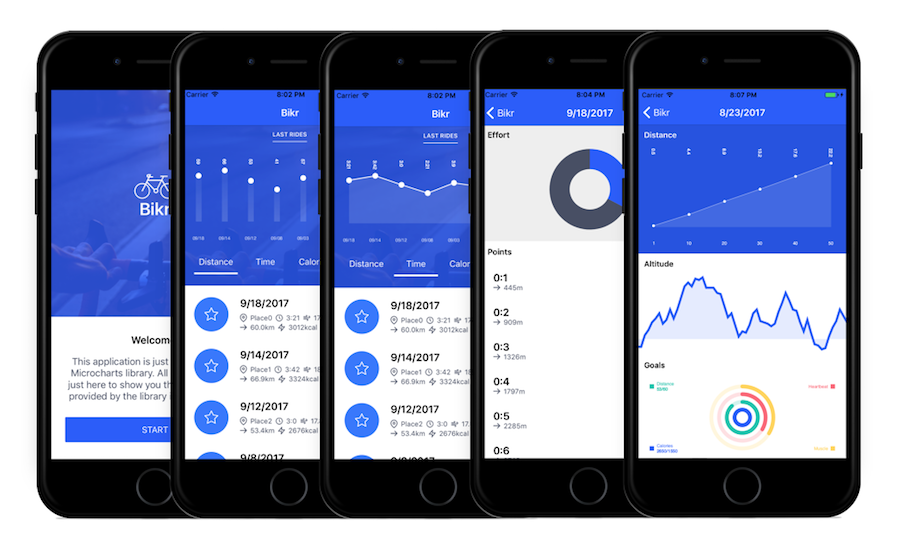
Microcharts provides ready-to-use charts for Android, iOS, macOS, UWP, and even Xamarin.Forms. If you’re already using SkiaSharp in your application, you can also render them into any SkiaSharp canvas.
Data Entries
Every chart displayed via Microcharts consumes a set of data entries, and they will always have the same structure regardless of the chart type that you want to display. Each entry will have:
- A floating number representing its value (required).
- A
Labeldescribing what your entry is associated with. - A
ValueLabelto format your value. - A
Colorassociated with the entry.
Here’s a quick sample of a set of entry points that we’ll chart in a moment:
var entries = new []
 {
     new Entry(212)
     {
         Label = "UWP",
         ValueLabel = "212",
         Color = SKColor.Parse("#2c3e50")
     },
     new Entry(248)
     {
         Label = "Android",
         ValueLabel = "248",
         Color = SKColor.Parse("#77d065")
     },
     new Entry(128)
     {
         Label = "iOS",
         ValueLabel = "128",
         Color = SKColor.Parse("#b455b6")
     },
     new Entry(514)
     {
         Label = "Shared",
         ValueLabel = "514",
         Color = SKColor.Parse("#3498db")
} };
Chart Types
A wide range of charts are included in Microcharts, so you can pick the one that fits your application and data best. All you need to do is set the data entries through the Entries property of any chart control.
BarChart
var chart = new BarChart() { Entries = entries };
LineChart
var chart = new LineChart() { Entries = entries };
PointChart
var chart = new PointChart() { Entries = entries };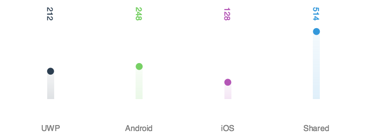
RadialGauge
var chart = new RadialGaugeChart() { Entries = entries };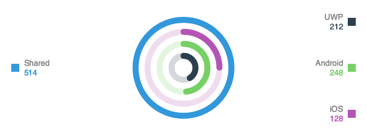
Donut
var chart = new DonutChart() { Entries = entries };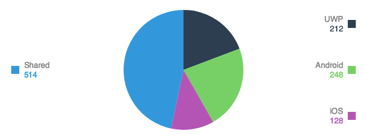
Radar
var chart = new RadarChart() { Entries = entries };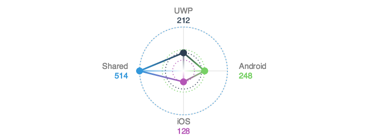
Displaying a Chart
To display a chart, we’ll need to host it in a ChartView.
<ContentPage>
     xmlns="http://xamarin.com/schemas/2014/forms"
     xmlns:x="http://schemas.microsoft.com/winfx/2009/xaml"
     xmlns:microcharts="clr-namespace:Microcharts.Forms;assembly=Microcharts.Forms"
     xmlns:local="clr-namespace:Microcharts.Samples.Forms"
     x:Class="Microcharts.Samples.Forms.MainPage">
     <microcharts:ChartView x:Name="chartView" />
</ContentPage>
The chart data can now be affected by the view Chart property.
this.chartView.Chart = chart;
The Chart property is a bindable property, so it’s also perfectly fine to use a binding from a ViewModel
for this.
<microcharts:ChartView x:Name="chartView" Chart="{Binding Chart}" />
The above example uses Xamarin.Forms, but built-in views are also available for iOS, Android, macOS, and UWP directly.
Tweaking the Visual Aspect
Each type of graph has several properties to slightly modify its final rendering. For example, our previous LineChart example looked like this :
var chart = new LineChart()
 {
   Entries = entries
 };
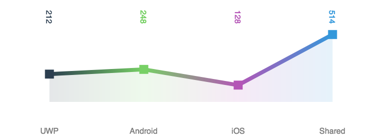
By changing the line and point properties, we can finely tune the design:
var chart = new LineChart()
 {
   Entries = entries,
   LineMode = LineMode.Straight,
   LineSize = 8,
   PointMode = PointMode.Square,
   PointSize = 18,
};
Feel free to explore each chart property to make it your own and create a unique design.
Sample Application
For a more contextual usage of Microcharts, please take a look at the dedicated repository, which shows off a biking application with various use cases for charts.
This is just the beginning!
Microcharts is still young and will continue to be improved, so stay tuned on GitHub or Twitter! This project is open-source, so please don’t hesitate to share new charts type, missing properties, and issues.

