Visual Studio 2022 17.7 introduces a set of exciting performance improvements that cater to key areas like F5 Speed, Enhanced Light Bulb Performance in C#, improved memory consumption in C# spell checker, C++ Unreal Engine – IntelliSense optimization, Solution Explorer, Find in Files and much more. Our key theme is to elevate the performance of Visual Studio and these performance enhancements pave the way for a seamless and productive coding journey in Visual Studio 2022 17.7. Embrace the power of these upgrades and experience a new level of development efficiency. Happy coding!
Enhanced F5 Speed
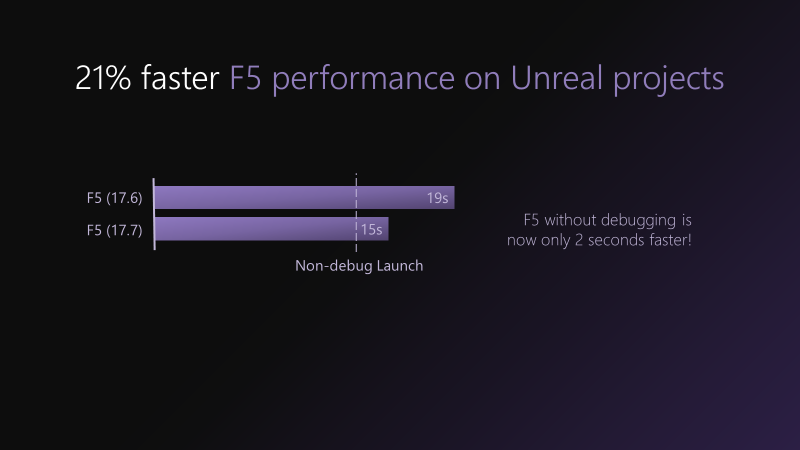
The F5 experience has been improved by significantly optimizing the performance of opening PDBs (Program database files), resulting in a 4-second improvement in the time it takes to display the Unreal Editor project selection screen. This improvement particularly benefits debugging native code, but managed debugging with non-Portable PDBs will also experience advantages.
Furthermore, we have optimized the F5 path to better parallelize and load debugging components. For the initial F5 (cold F5), we anticipate a 5-10% improvement in the time it takes to start the debugger and launch the process, based on telemetry from an experiment especially for the initial F5. In a test with Unreal Editor, when launched within the debugger the project selection screen came up 21% faster.
Enhanced Light Bulb performance in C#
Further performance enhancements to the light bulb feature in C#. With speed improvements to how Visual Studio determines what actions to show, fixing traditionally slow code fixes like Fix Formatting and Simplify Type Name is now faster than ever. Enjoy immediate suggestions and fixes, even in large documents or after making edits.
Improve memory consumption in C# spell checker
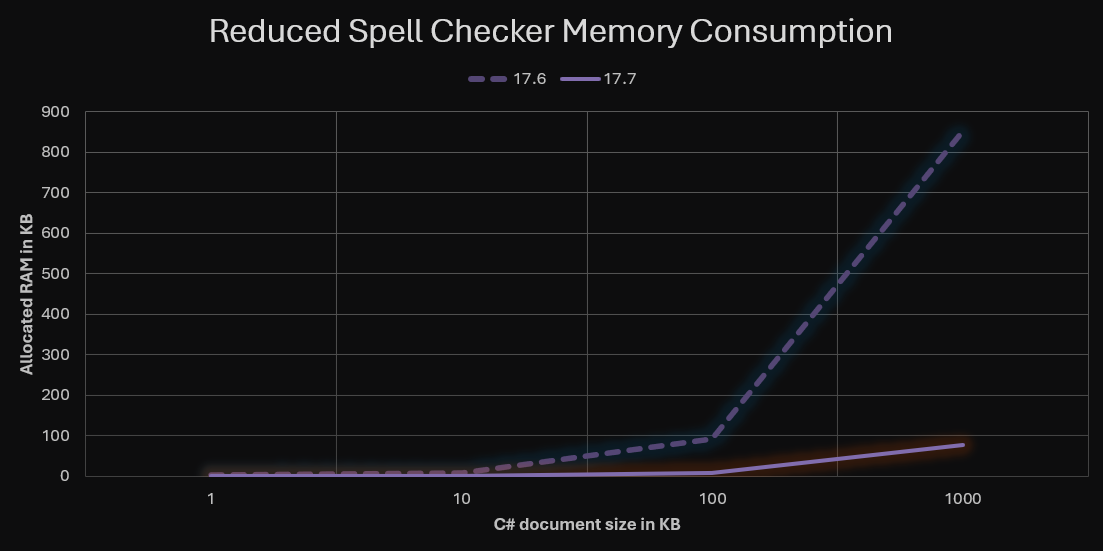
The LSP (Language Server Protocol) for the C# spell checker underwent significant improvements. By implementing a more efficient data structure and enabling streaming support, we achieved a remarkable 90% reduction in the memory footprint of the JSON transferred between the LSP Server and LSP Client. This enhancement leads to faster performance, increased efficiency, streamlined communication, and improved scalability for the spell-checking functionality.
C++ Unreal Engine – IntelliSense optimization
In Unreal Engine projects, the time for IntelliSense and colorization to become ready in a newly opened C++ file has been significantly reduced. The generation of IntelliSense cache (IPCH) is now 30% faster in Unreal Engine 5.1 and 5.2 projects, and 15% faster in Unreal Engine 4.27 projects.
Dependencies tree in Solution Explorer
The “Dependencies” tree of SDK-style .NET projects underwent a complete rewrite with a focus on improving both performance and correctness. This update addressed several bugs and significantly enhanced the rendering speed when opening projects and making changes. As a result, when loading a project that has already been restored, you will no longer experience the issue of yellow triangles momentarily appearing in the tree and then disappearing a few seconds later. The revamped “Dependencies” tree provides a smoother and more reliable project loading experience for developers.
Find in Files
The “Find in Files” search time has been greatly improved through the implementation of several techniques. These include reducing allocations through pooled objects, minimizing unnecessary file system API calls such as file existence and last write time checks, and decreasing exception throws for binary files. These optimizations enhance the search performance, efficiency, and overall user experience.
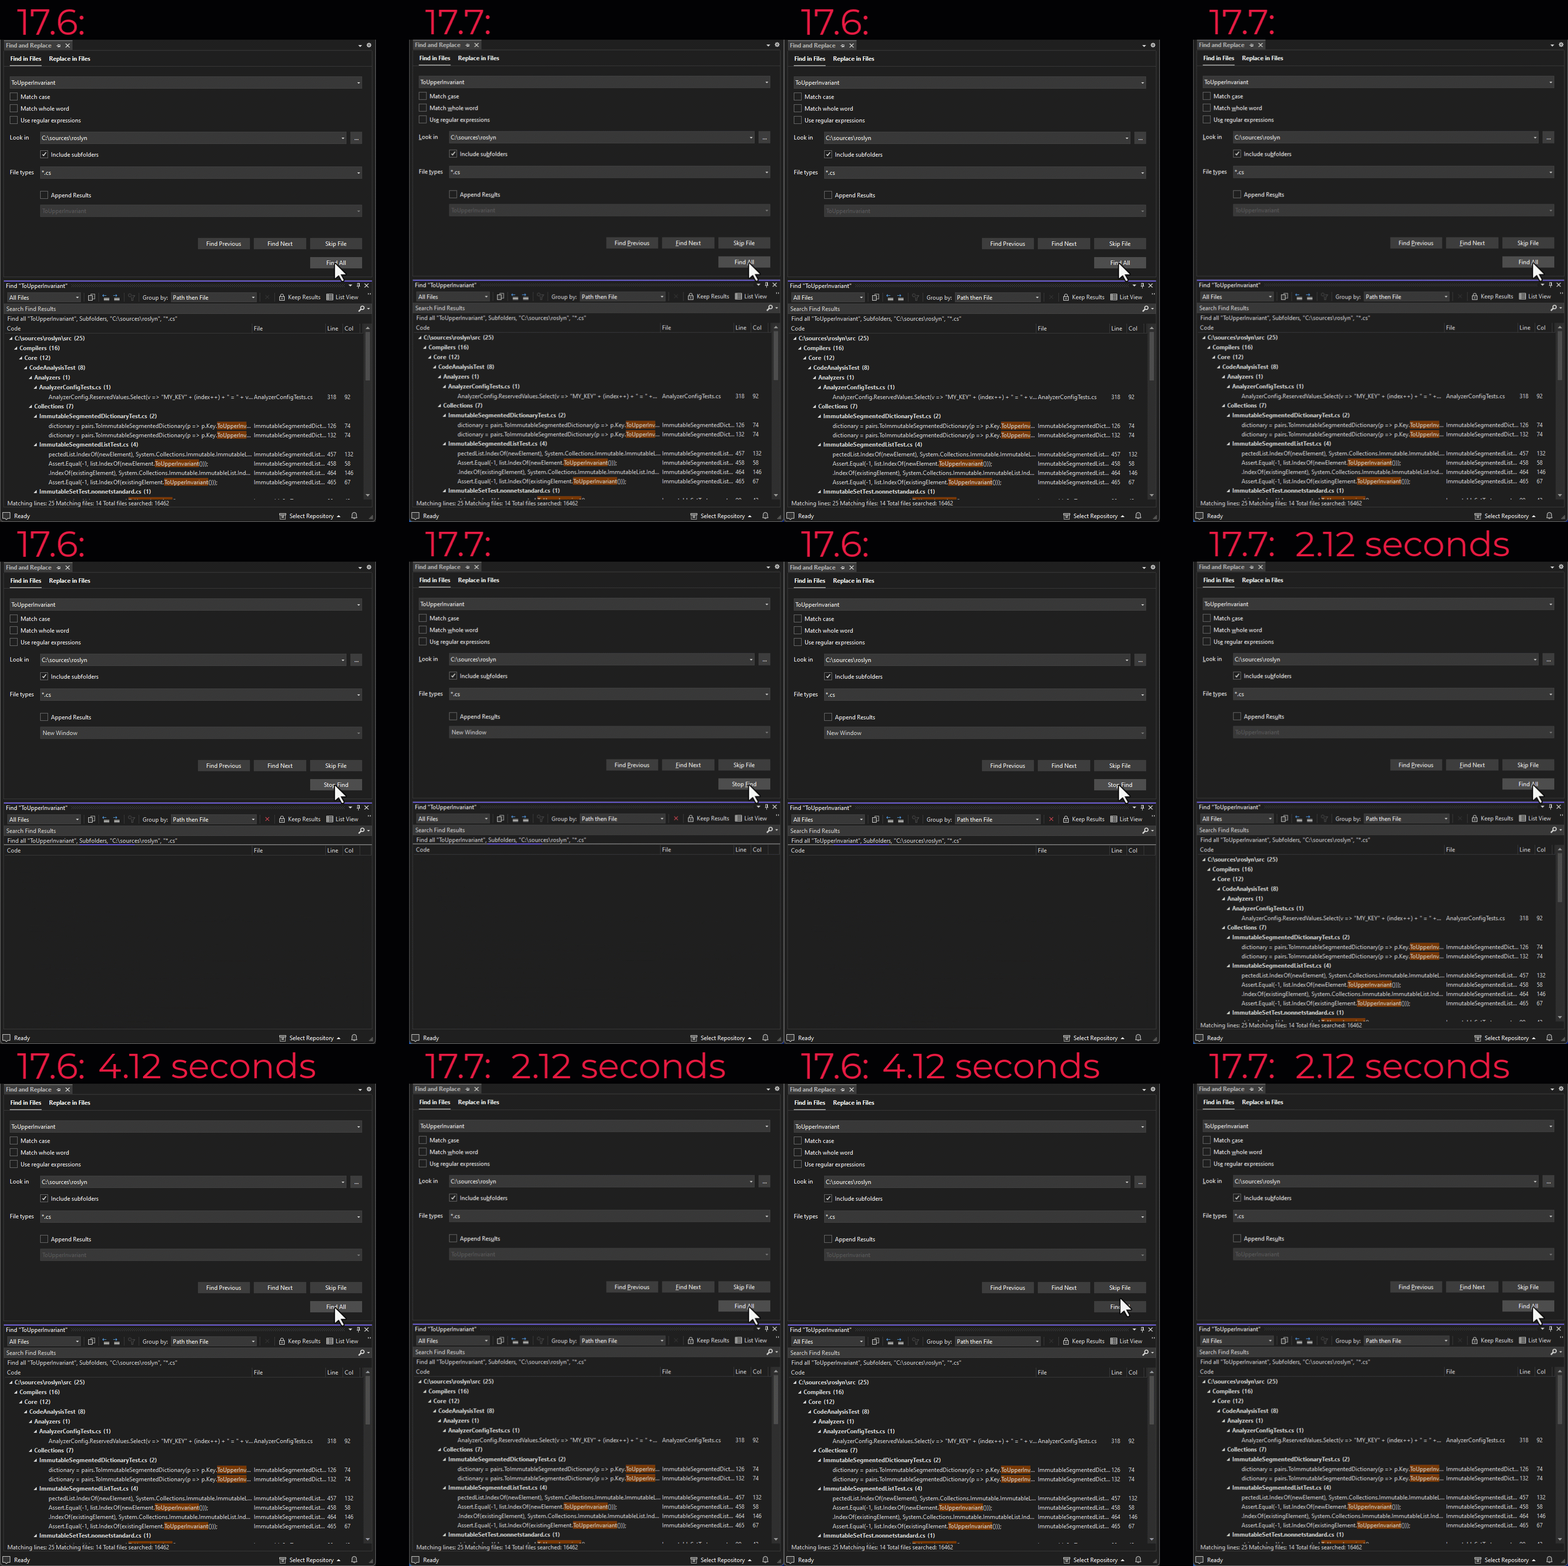
In the previous version (17.6), searching for the text string “ToUpperInvariant” in all .cs files within the Roslyn code base took 4.12 seconds. In 17.7 with the latest performance enhancements, the same search now completes in an impressive 2.12 seconds—a nearly 50% reduction in search time!
Runaway NuGet restore detection
Previously, the NuGet package restore operation occasionally encountered an issue where it would get stuck in a loop due to certain properties having cyclical nature. The automatic background restoration of projects’ packages now includes a detection mechanism for runaway restores. The cyclic property causing endless loops is broken, and a message is displayed to alert users about the problem. This enhancement avoids wasted CPU usage and ensures a more responsive environment for developers.
ServiceHub – JIT reduction improvement
Visual Studio launches “ServiceHub” processes in the background which enable important functionalities, such as identity management, language services like IntelliSense etc. These processes launch behind the scenes when Visual Studio itself starts up or opens a solution. Hence it is important that the overhead from these processes is kept to a minimum. It was observed that JIT compilation of code in these processes was consuming non-trivial amount of CPU and IO. AppDomains within ServiceHub processes were restructured such that there was better code sharing and more precompilation of code. These changes resulted in remarkable reduction in JITing time during Visual Studio startup, leading to a smoother and faster user experience.
Improving the fundamentals
Visual Studio has a continuous, data-driven focus on improving quality fundamentals such as crashes, freezes, excessive memory usage, etc. Recently new telemetry was brought online to provide insight on excessive CPU usage and allocation issues leading to unresponsiveness. These enhancements provide the Visual Studio team with deeper insights into Visual Studio’s performance, enabling more effective troubleshooting and optimization. As a result, over 160 performance issues have been fixed across the product in 17.7, including significant improvements to NuGet restore, Find in Files, and more optimal parallel loading of solutions.
We value your opinion!
We believe these performance enhancements will significantly improve your development experience, making it more efficient and enjoyable. Your feedback is crucial in helping us enhance the product and meet your expectations. We encourage you to provide feedback with us via Developer Community: report any bugs or issues via Report-a-Problem and share your suggestions. Alternatively, feel free to leave your comments below. We appreciate your input and look forward to continuously improving Visual Studio with your valuable insights.


Compilation time on Blazor Web Assembly projects seems to have dramatically increased on the latest version.
Microsoft Visual Studio Community 2022 (64-bit) – Current
Version 17.7.3
Is this a common issue reported by others?
The code startup time seems to drop a lot compared to the previous version, the difference is massive to us. It was like few seconds the .NET7 MVC app could spin up now it will take up almost 2mins to see the first paint. Did we change anything around this area?
Hi Shan, thank you for your feedback. Are you seeing this within Visual Studio or any other standalone platforms?
Performance improvement is always welcome.
Please try to make it lighter as much as visual studio code.
When are will MS allow startup objects be sorted alphabetically under:
Project ->Properties/Startup/object?
It might be fine for individuals with only a few “objects” but on large projects it’s a absolute pain to scroll up and down looking for a form one wants to change.
Michael O’Rourke
Merci pour ces améliorations.
Mais l’ouverture de VS 17.7 Community est bien bien trop longue.
Encore une amélioration à réaliser…
When triple quotes in Razor Editor will be fixed? https://github.com/dotnet/razor/issues/7084
Thanks for the review!
Performance improvements will always be welcome!