


In Visual Studio 2026 we introduced Copilot Profiler Agent, a new AI-powered assistant that helps you analyze and optimize performance bottlenecks in your code. By combining the power of GitHub Copilot with Visual Studio’s performance profiler, you can now ask natural language questions about performance, get insights into hot paths, and quickly identify optimization opportunities. Let’s walk through a real-world example of how this tool can help you make meaningful performance improvements.
Benchmarking a real project
To demonstrate the capabilities of the Copilot Profiler Agent, let’s optimize CsvHelper, a popular open-source project. You can follow along by cloning my fork of the repo then checking out to right before my fix that we will detail below with git checkout 435ff7c. If you just want to see it in action you can watch along in our toolbox episode demonstrating this.
In one of my previous blog posts I added a CsvHelper.Benchmarks project that contains a benchmark for reading CSV records. This time I want to see if we can optimize writing CSV records instead. Normally I would start this investigation by creating a benchmark for the code that I want to optimize, and while we will still do that we can have Copilot do the toil work for us. In the Copilot Chat window I can ask @Profiler Help me write a benchmark for the #WriteRecords method. The @Profiler gets us talking directly with the Copilot Profiler agent and #WriteRecords tells it exactly the method we are interested in benchmarking. 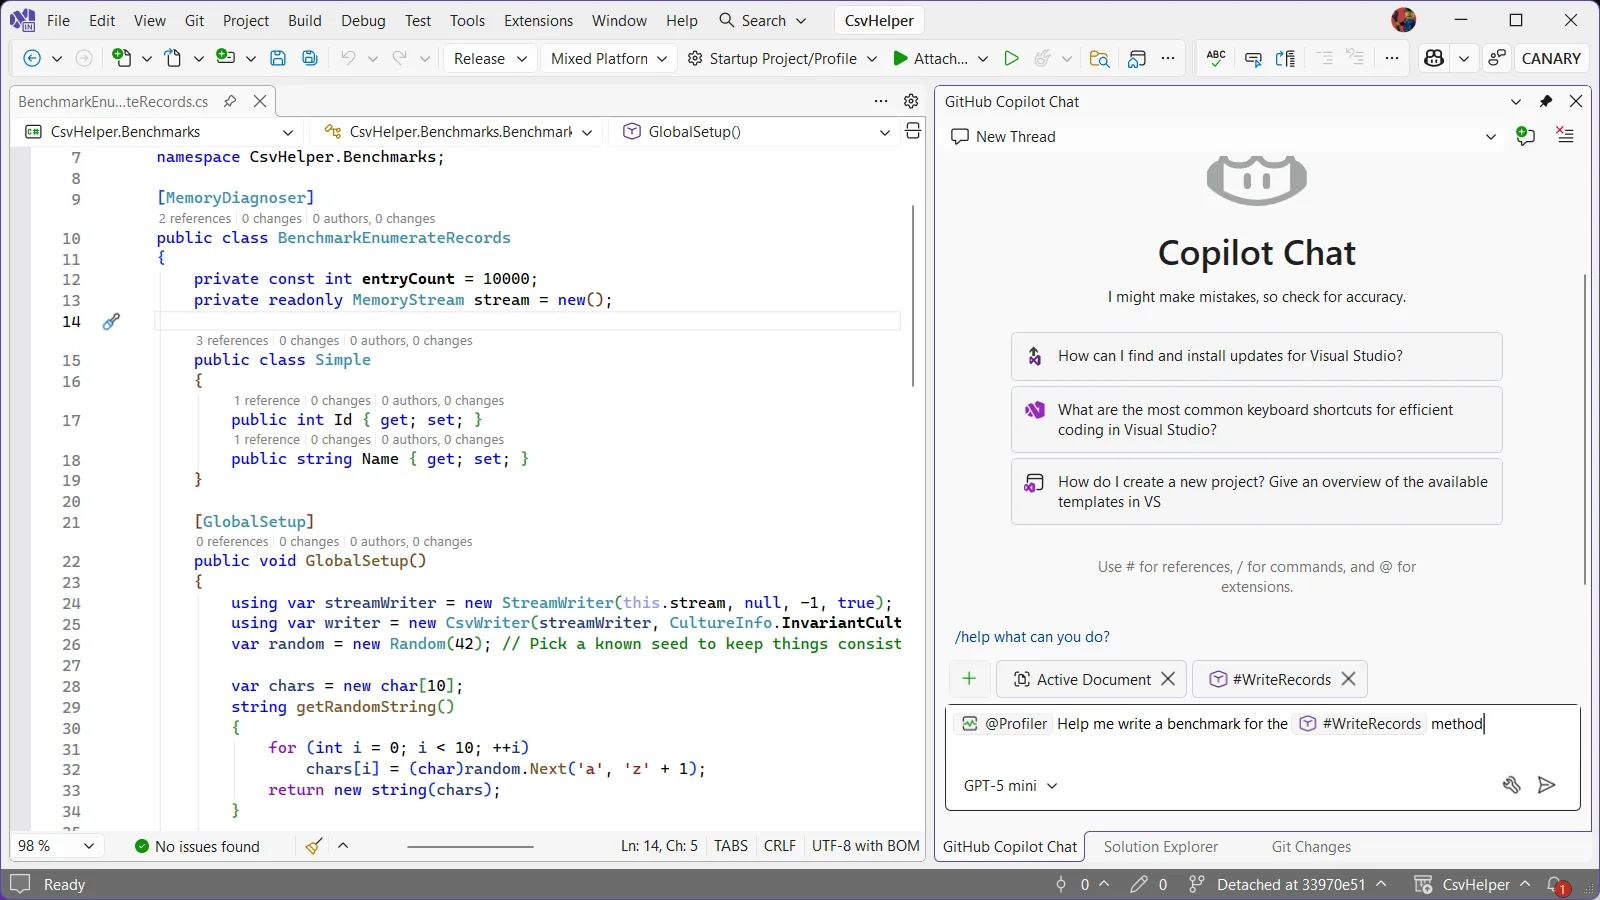
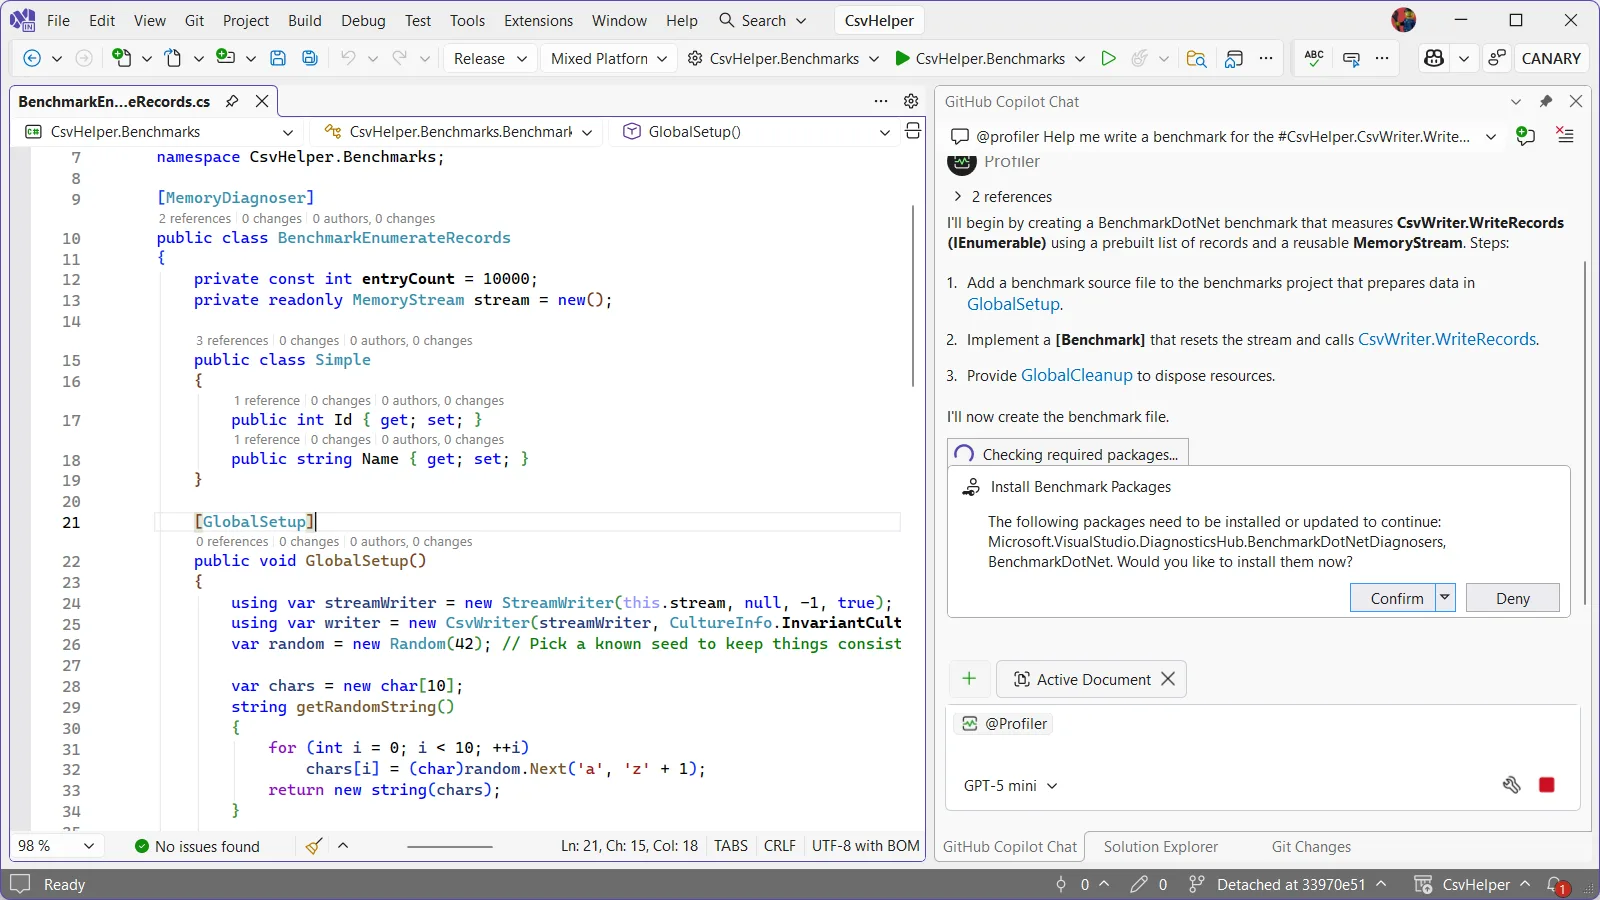
From here Copilot starts creating our new benchmark, asking us if its ok to install the profiler’s NuGet package to pull information from the benchmarks when it runs it. It also models the benchmarks after any existing benchmarks that it finds so the resulting benchmark is very similar to the one we already wrote keeping things consistent with the style of the repository. Lastly, it kicks off a build to make sure everything is good.
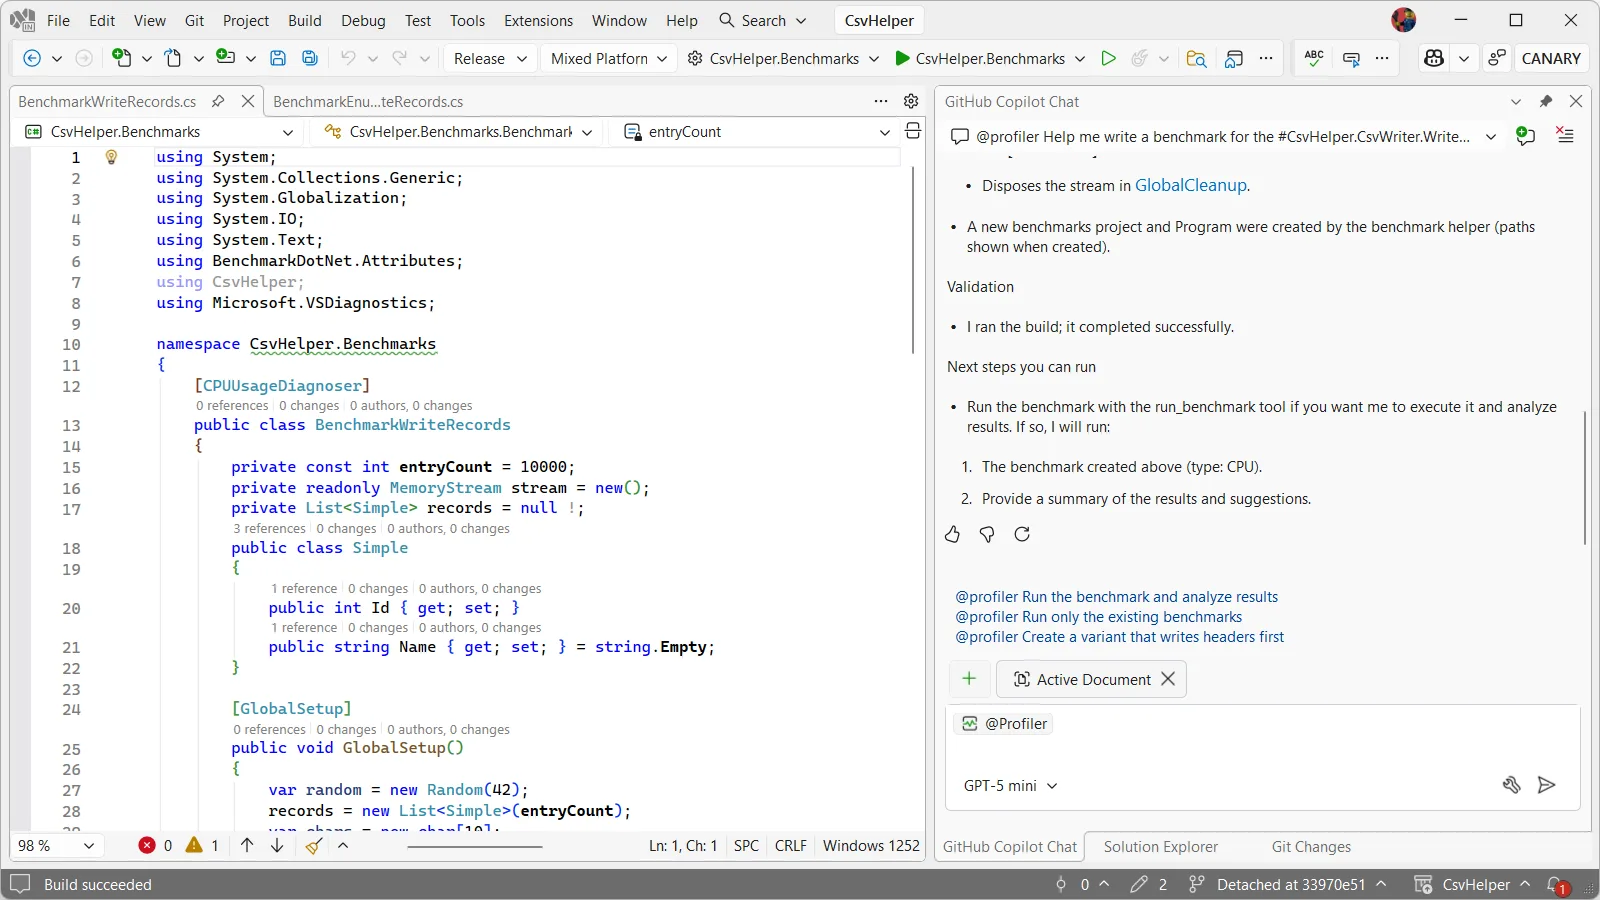
Once it’s done, it provides some useful follow-up prompts to start the investigation. We could click one of these to launch into our investigation, though I want to edit things slightly in the benchmark.
I tweaked the benchmark to have a few more fields for us to write, in this case 2 int fields and 2 string fields. When I originally had Copilot do this, before writing it up for this blog, instead of writing to the same memory stream it wrote to a new one each time. Writing into the same memory stream is probably the better way to go about things, you win this time Copilot, but in my original PR to CsvHelper I didn’t and it should be fine.
public class BenchmarkWriteCsv
{
    private const int entryCount = 10000;
    private readonly List records = new(entryCount);

    public class Simple
    {
        public int Id1 { get; set; }
        public int Id2 { get; set; }
        public string Name1 { get; set; }
        public string Name2 { get; set; }
    }

    [GlobalSetup]
    public void GlobalSetup()
    {
        var random = new Random(42);
        var chars = new char[10];

        string getRandomString()
        {
            for (int i = 0; i < 10; ++i)
                chars[i] = (char)random.Next('a', 'z' + 1);
            return new string(chars);
        }

        for (int i = 0; i < entryCount; ++i)
        {
            records.Add(new Simple
            {
                Id1 = random.Next(),
                Id2 = random.Next(),
                Name1 = getRandomString(),
                Name2 = getRandomString(),
            });
        }
    }

    [Benchmark]
    public void WriteRecords()
    {
        using var stream = new MemoryStream();
        using var streamWriter = new StreamWriter(stream);
        using var writer = new CsvHelper.CsvWriter(streamWriter, CultureInfo.InvariantCulture);
        writer.WriteRecords(records);
        streamWriter.Flush();
    }
}
Getting insight into the benchmark
Now to get started with the analysis I can either ask Profiler Agent to run the benchmark or just click on the follow up prompt for @Profiler Run the benchmark and analyze results. From here Copilot edits my main method which at first glance might seem odd but when looking at the changes I see it made the necessary changes to use BenchmarkSwitcher so it can choose which benchmarks to run:
static void Main(string[] args)
{
// Use assembly-wide discovery so all benchmarks in this assembly are run,
// including the newly added BenchmarkWriteRecords.
_ = BenchmarkSwitcher.FromAssembly(typeof(BenchmarkEnumerateRecords).Assembly).Run(args);
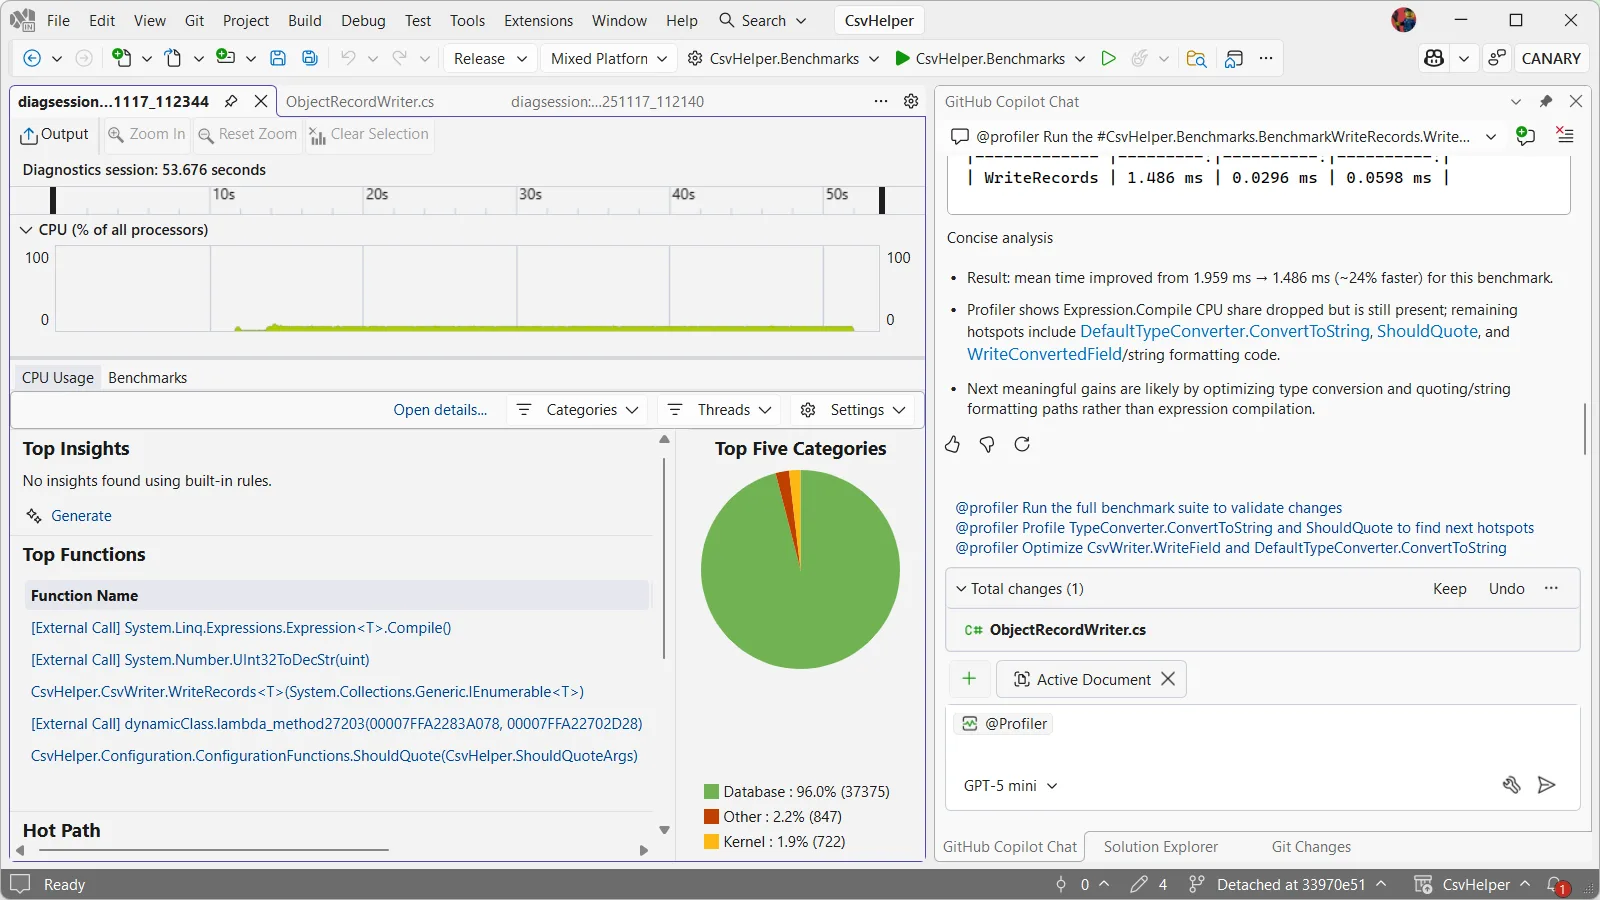
}Then it kicks off a benchmarking run and when it’s done I’m presented with a diagsession where we can begin investigating.
Using Copilot Profiler Agent to find bottlenecks
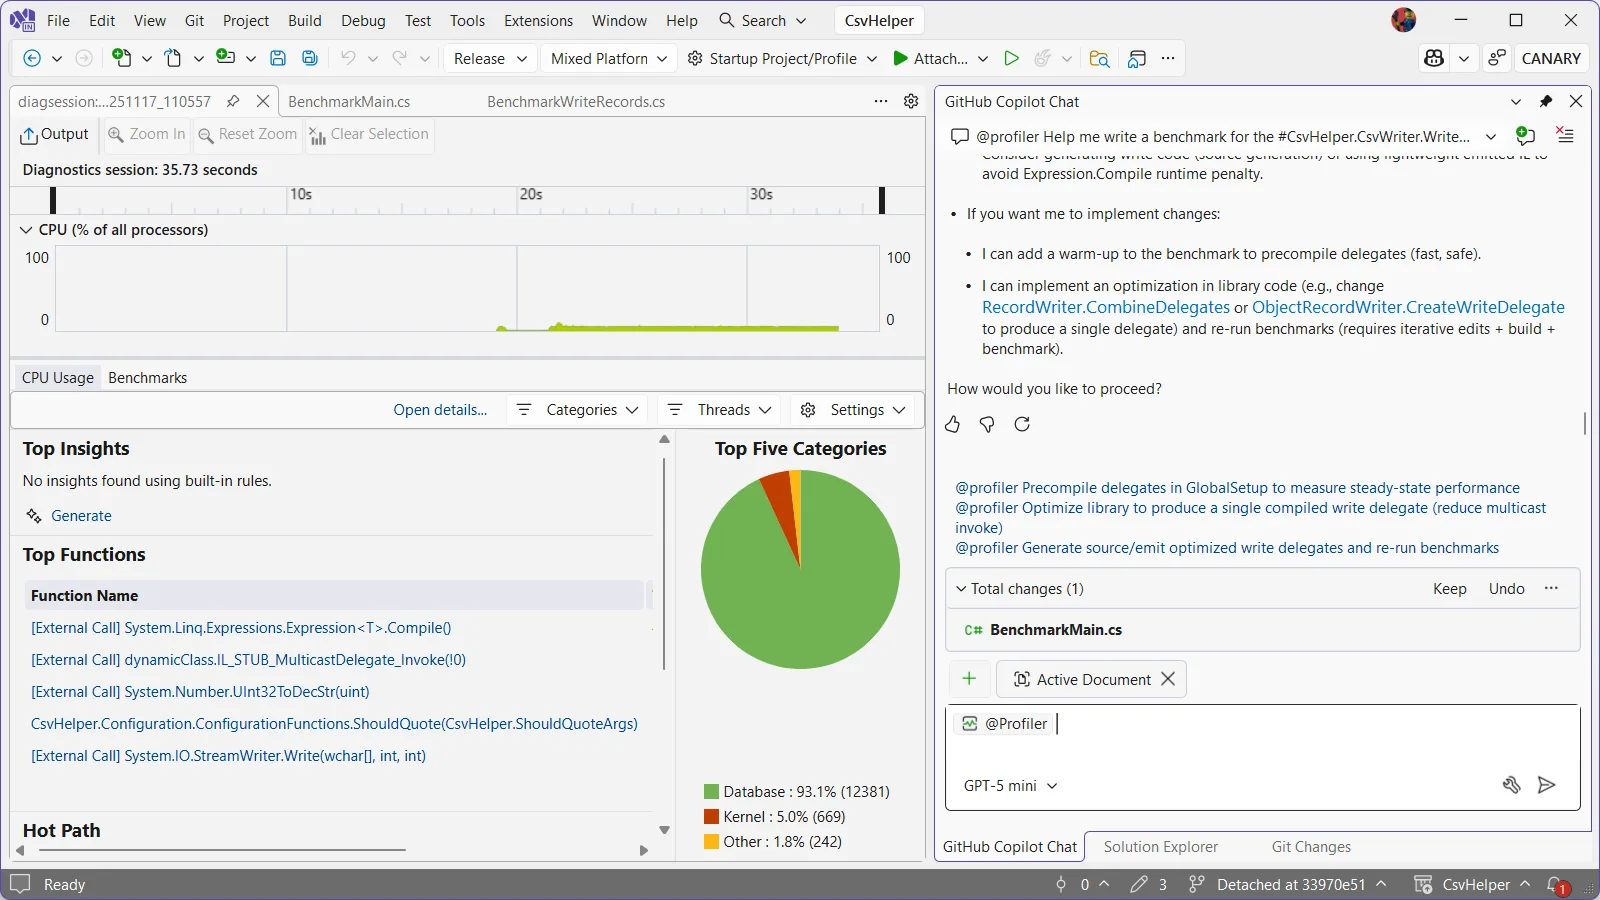
Now comes the exciting part. After running the benchmark, the Profiler agent analyzes the trace and highlights where time is spent. I can ask the Profiler Agent questions about the trace and have it explain why code is slow or why certain optimizations could help. It has already pointed out that most of the time is spent in delegate compilation and invocation, which is done for each field in the CSV record. For a record with 4 fields written 10,000 times, that means 40,000 delegate invocations. Each invocation has overhead, and this is showing up as a hot path in the profiler.
I can ask the Profiler Agent: “How can I reduce the delegate invocation overhead?” or “Why is delegate invocation slow” and the agent like a patient teacher will explain concepts and suggest fixes.
Implementing the fix
I’m going to click the @Profiler Optimize library to produce a single compiled write delegate (reduce multicast invokes) and see what it comes up with. The Profiler Agent makes an edit to ObjectRecordWriter and I can click on that in the chat window to see the diff of the changes it makes.
Looking at the current implementation, the code builds a list of delegates, one for each field:
var delegates = new List<Action>();

foreach (var memberMap in members)
{
    // ... field writing logic ...

    delegates.Add(Expression.Lambda<Action>(writeFieldMethodCall, recordParameter).Compile());
}

var action = CombineDelegates(delegates) ?? new Action((T parameter) => { });
return action;
The issue is that CombineDelegates creates a multicast delegate which invokes each individual delegate separately in series. Instead, Profiler Agent is suggesting we use Expression.Block to combine all the expressions before compiling:
var expressions = new List<Expression>(members.Count);

foreach (var memberMap in members)
{
    // ... field writing logic ...

    expressions.Add(writeFieldMethodCall);
}

if (expressions.Count == 0)
{
    return new Action<T>((T parameter) => { });
}

// Combine all field writes into a single block
var block = Expression.Block(expressions);
return Expression.Lambda<Action<T>>(block, recordParameter).Compile();
This change is small but elegant: instead of creating multiple delegates and invoking them sequentially, we create a single block expression containing all the field writes, then compile it once. Now all fields are written in a single call when we invoke the delegate for each record, with no additional delegate overhead.
Measuring the impact
After making this change, Copilot automatically reruns the benchmarks to measure the improvement. The results show approximately 24% better performance in this run with the profiler. Our previously staged PR for CsvHelper shows ~15% better performance. The CPU profiler confirms that we’ve eliminated the delegate invocation overhead and instead of 40,000 delegate calls for our 10,000 records with 4 fields each, we now have just 10,000 delegate calls.
This is a meaningful win for a library that’s already heavily optimized. For applications writing large CSV files with many fields, this improvement translates directly to reduced CPU time and faster processing. And because CsvHelper has millions of downloads, this optimization benefits a huge number of users. From here I went ahead and staged the PR, though Copilot helpfully provides more follow up prompts regarding the type conversion and ShouldQuote logic so that I could continue to improve performance further.
The power of Copilot Profiler Agent
What makes this workflow powerful is the combination of precise performance data from the Visual Studio Profiler with the analytical and code generation capabilities of Copilot. Instead of manually digging through CPU traces and trying to understand what the hot paths mean, you can ask natural language questions, get actionable insights, and quickly test ideas.
The agent doesn’t just tell you what’s slow – it helps you understand why it’s slow and suggests concrete ways to fix it. In this case, it identified that delegate invocation overhead was the bottleneck and suggested the Expression.Block optimization, which is exactly the right solution for this problem. It even reran the benchmarks to confirm the optimization!
Let us know what you think
We’ve shown how the Copilot Profiler Agent can help you take a real-world project, identify performance bottlenecks through natural language queries, and make meaningful improvements backed by data. The measure/change/measure cycle becomes much faster when you can ask questions about your performance data and get intelligent answers. We’d love to hear what you think!
0 comments