We hope you all enjoyed the new and updated features that came with our first preview of Visual Studio 17.10, and now we have even more to share! This release brings additional tools to help you improve your code reviews with Copilot, diagnostics improvements, as well as additional Extensibility and WinForms enhancements.
Browse this list of updates and let us know which of these enhancements is your favorite:
Area |
Features |
| Productivity |
|
| WinForms Designer |
|
| SQL Server Developer Tools |
|
| Extensibility |
|
| Debugging and Diagnostics |
|
To explore the full list of improvements, you can read the Visual Studio 2022 17.10 Preview 2 Release Notes, and we always appreciate your feedback through Developer Community: report any bugs or problems via report a problem and share your ideas for new features or enhancements to existing ones.
Productivity
Improve Your Code Reviews with Copilot Generated Pull Request Descriptions
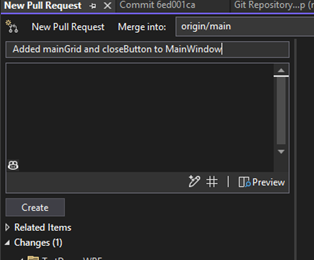
We’ve heard awesome feedback on our generated Git commit message feature, so we wanted to continue saving you time and improving your collaborations by enabling GitHub Copilot-powered pull request descriptions. You can now generate a first draft for your pull request description driven by Copilot analysis of all the changes included in the pull request. You can also view it using the markdown preview. You’ll get assistance in providing important context to your colleagues for their reviews and get the added benefit of ensuring you’re including the right changes in your pull request.
To try it out, you’ll need to have an active GitHub Copilot subscription and the GitHub Copilot Chat Extension installed. You can click the sparkle pen icon within the Create a Pull Request window to see your description. Please share your feedback on this feature here.
Unravel Your Commit History with GitHub Copilot
Git history can be daunting to shuffle through, but it’s often the best way to learn about a code base or help identify the origin of a bug. We’ve added a GitHub Copilot powered explain feature to the Commit Details window to make it easier to understand the contents of each commit.
You’ll need an active GitHub Copilot subscription and the GitHub Copilot Chat Extension installed. Double click on any commit to open the Commit Details pane in the Git Repository window. Then, click on the “Explain Commit” icon to get a summary of the changes side by side with the code. We’ll continue improving this feature and encourage you to share your feedback on this update here.
View and Address Pull Request Comments in Visual Studio Editor
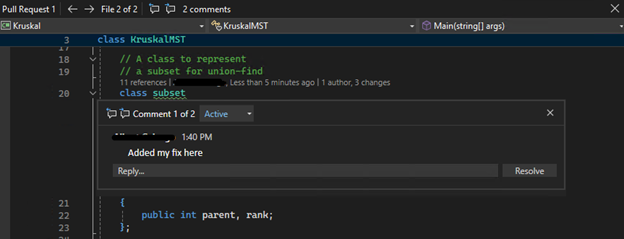
Since code review is such an integral part to your collaboration workflow, we’ve been working hard on one of your highly request Git suggestions, pull request integration. You can now view your GitHub and Azure DevOps pull request comments directly in your working file in Visual Studio. You remain in your context, making necessary code changes and interacting with your colleagues’ suggestions, without switching contexts to the browser.
Enable the feature flag, “Pull Request Comments,” and checkout the pull request branch to get started:
You can navigate between files in the pull request and comments in the files using the toolbar.
We’d love to hear your feedback as we improve this feature, so let us know what you think. A known bug we’re already working on improving for the next release is skipping deleted files or special file types that you cannot open from Solution Explorer.
Improve the readability of Visual Studio with new text formatting options
We’ve a long-standing request from developers like you asking us to bring support for additional text formatting options to the Visual Studio IDE. With the release of Visual Studio 17.10 Preview 2, we’ve brought Italics as well as strikethrough and underline options to the available options for configuring the way your code text is displayed.
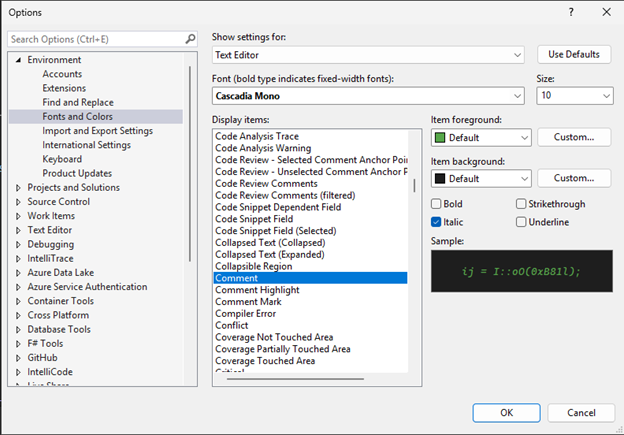
To change your preferences for the way text appears in the IDE, use the “Fonts and Colors” page found in Tools > Options > Environment to select the “Display items” you’re interested in modifying. You’ll find the existing “Bold” checkbox in addition to three new checkboxes for “Italic”, “Strikethrough”, and “Underline”. The screenshot below shows these new checkboxes on the right side just above the text sample.
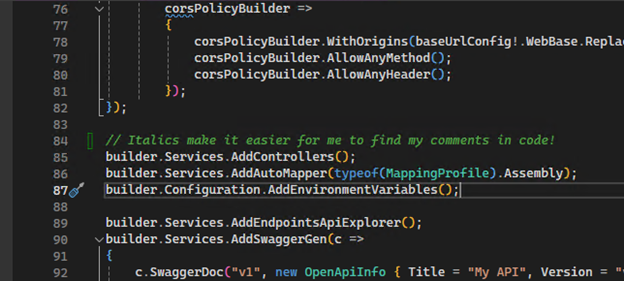
We’ve used the Fonts and Colors page to configure code comments in the code editor to show up Italicized. Note that you can customize other areas of the IDE by using the “Show settings for:” dropdown. Try it out and let us know what you think!
Windows Forms out-of-process designer
Performance improvements in server process TypeResolution service
We are pleased to announce substantial performance improvements to the WinForms out-of-process designer. Notably, you’ll find performance gains during scenarios that trigger server process restart and designer reload, such as project rebuilds or adjustments in project references. These enhancements have yielded remarkable design time performance improvements, ranging from 30% to 50% in a typical line of business applications.
We encourage you to explore the updated designer and share your invaluable feedback through Developer Community site so that we can continue improving WinForms designer performance.
SQL Server Developer Tools support for ARM64
We are bringing support for SQL Server Developer Tools (SSDT) in Visual Studio on ARM64. Features like SQL Projects, schema compare, data compare, query editor, and table designer are now available. We are taking this initial action because of the strong demand expressed by the customers looking for SQL developer tooling support on Arm64 devices.
While this initial release has missing features, we’ll be resolving these gaps during this preview release cycle. Please provide feedback on the SSDT features that are most important to you on the Developer Community site.
Extensibility
In the previous 17.9 minor release, we announced the ability for the Visual Studio installer to load extensions that are specified in a *.vsconfig file. We’re building on this capability in Visual Studio 2022 version 17.10 by enabling you to use the Visual Studio installer to export Marketplace extensions into a *.vsconfig file that were previously loaded in a machine-wide context. This new feature is the next step in our evolution to support common extension operations (install, import, export, update, etc.) using the Visual Studio installer.
Please try out this feature and let us know what you think. You’re also welcome to submit any additional feedback, suggestions, or general upvotes in our Developer Community by using one of the existing tickets or by creating your own new one:
- Ability to export non-marketplace or user context extensions into a *.vsconfig file
- VS Solution load should detect and prompt installing missing non-marketplace extensions specified in a *.vsconfig file.
Debugging and Diagnostics
Profiler visualization with new UpDown and ObservableCounter instruments
.NET applications can be instrumented using the System.Diagnostics.Metrics APIs to track important metrics relevant to your situation. The .NET Counter profiler in Visual Studio now introduces support for two of these innovative metrics:
- UpDown enables real-time tracking of values with both incremental and decremental changes.
- ObservableCounter autonomously manages aggregated totals, offering customizable callback delegates for precise control.
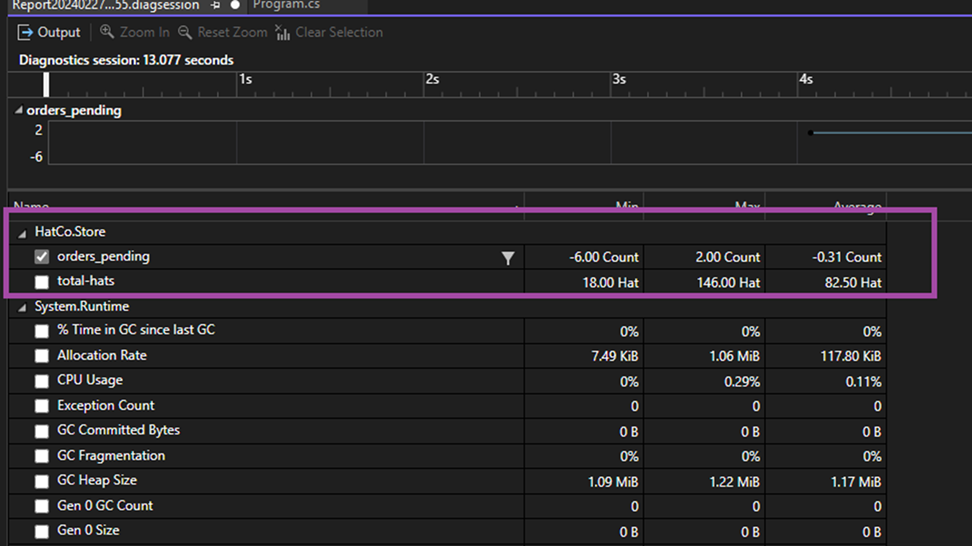
In the following screenshot, “total-hats” illustrate an UpDown counter, while “orders-pending” demonstrates an ObservableCounter.
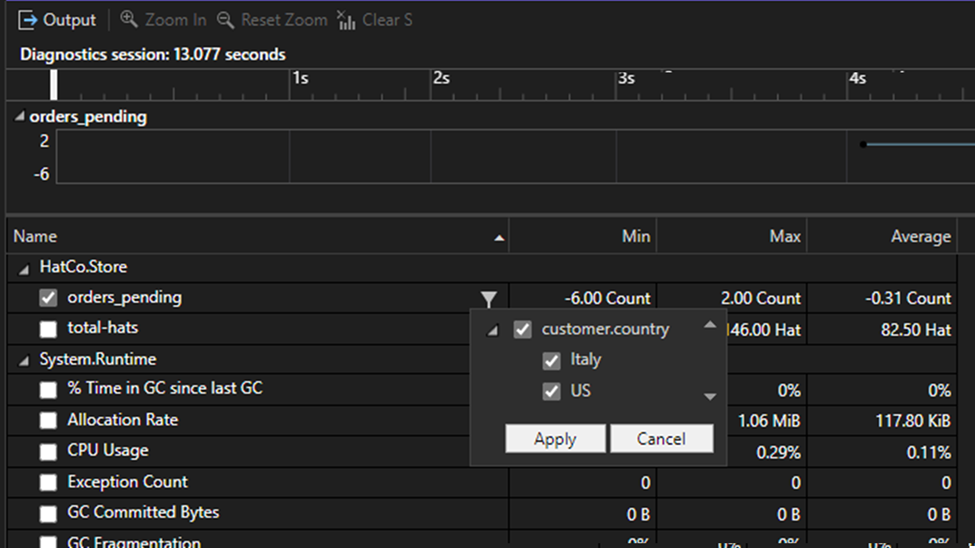
Moreover, we’ve implemented a filter flyout feature, enabling you to conveniently filter data points based on tags. This dynamically adjusts both summary and swimlane views according to the applied combinations.
This enhancement significantly improves flexibility, streamlining the monitoring of dynamic values in projects. For instance, in web application development, the UpDown counter can monitor user interactions such as page views, while the Observable Counter optimizes server resources by efficiently managing active session totals. Please share your suggestions for new features or improvements.
GC Insights in Managed Memory Window
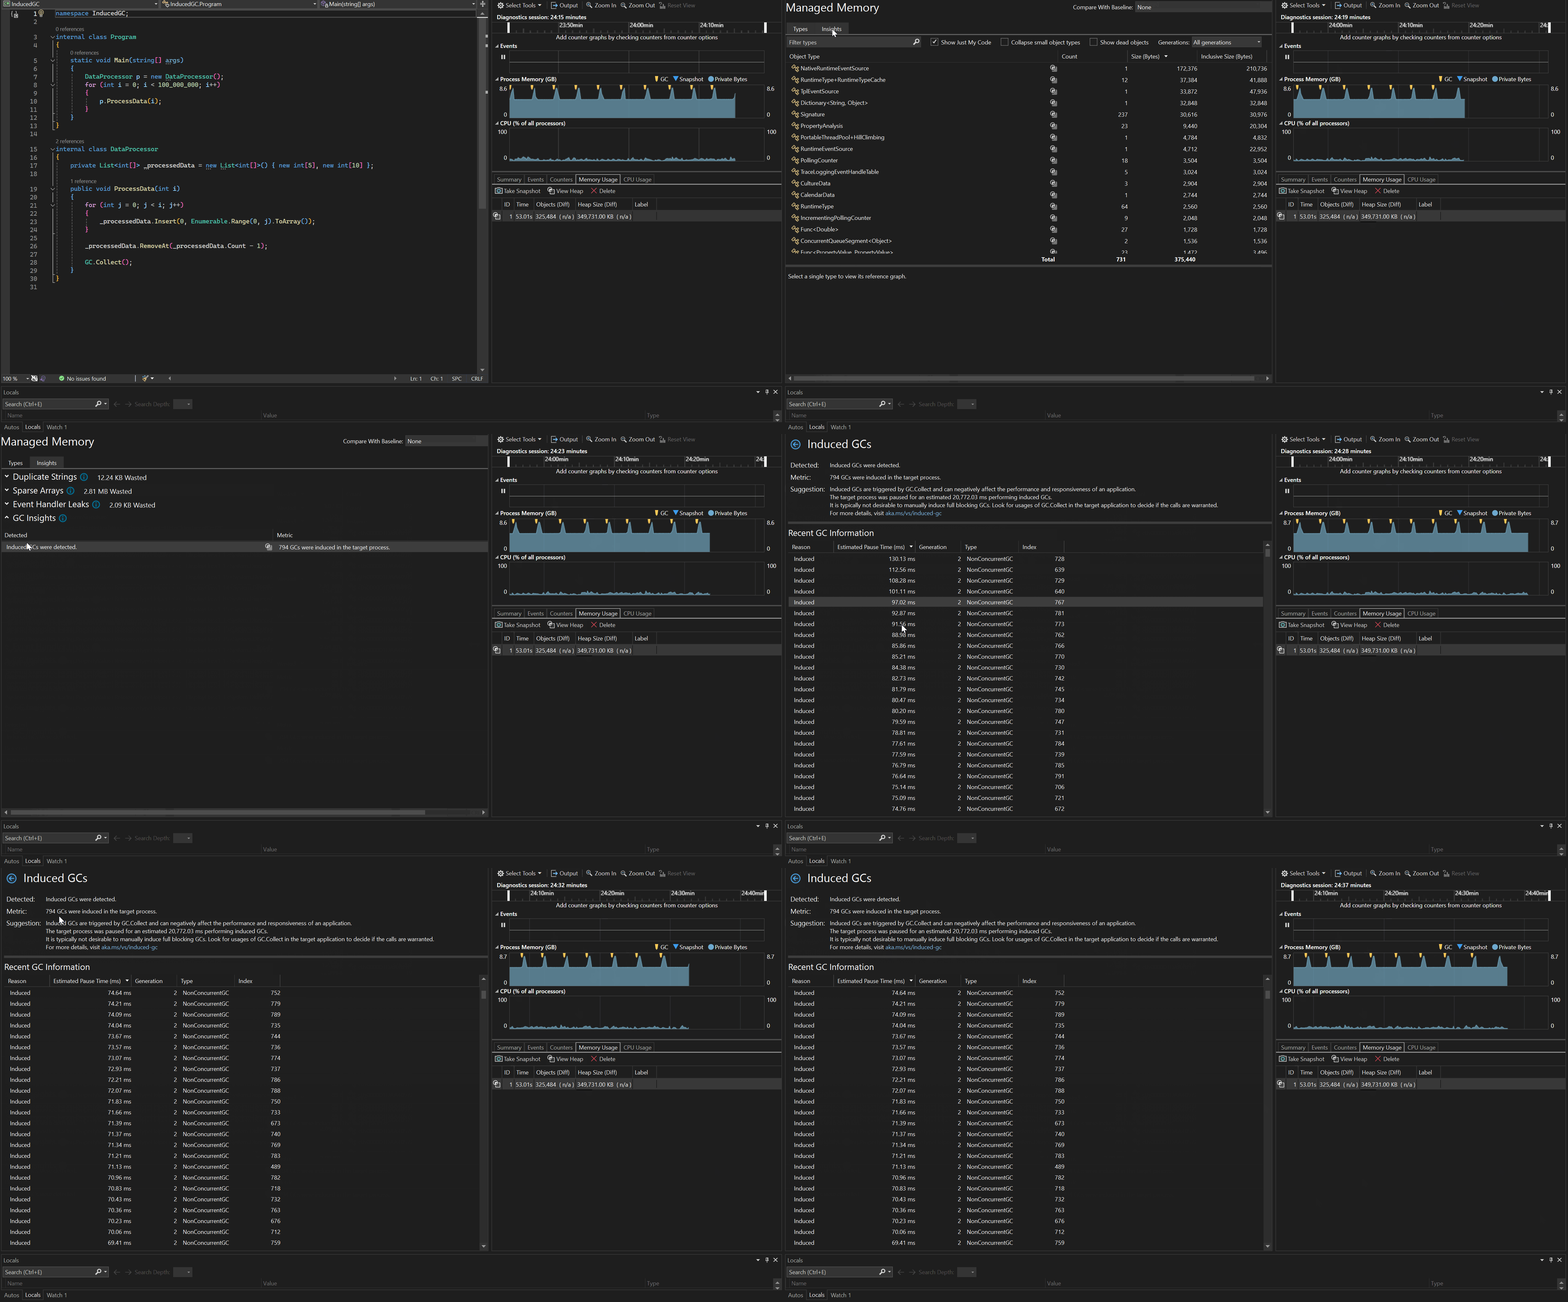
The Managed Memory window Insights tab now supports Garbage Collection (GC) Insights. This feature provides a deeper understanding of your application’s performance by shedding light on instances of induced GC. These instances are generally considered undesirable as they can impede the efficiency of your processes, since they involve manual intervention rather than allowing the Garbage Collector to autonomously manage memory allocation.
Furthermore, GC Insights offers the ability to analyze these occurrences with time estimates, allowing you to better comprehend the impact of induced GC on their application’s execution timeline.
Share your feedback and stay connected with Visual Studio!
We appreciate the time you’ve spent reporting issues and sharing your suggestions. We hope you continue to give us feedback when using Visual Studio on what you like and what we can improve. Your feedback is critical to help us make Visual Studio the best tool it can be! You can share feedback with us via Developer Community: report any bugs or issues via report a problem and share your suggestions for new features or improvements to existing ones.
Stay connected with the Visual Studio team by following us on YouTube, Twitter, LinkedIn, Twitch and on Microsoft Learn.
On behalf of the whole Visual Studio team, thanks for reading and Happy Coding!




0 comments