Over the past few months, during the lead-up to the TypeScript 5.0 beta, our team spent a good portion of our time looking for ways to improve the performance of our compiler so that your projects build faster. One of the ways we improved was by looking into an oft overlooked aspect of many JavaScript VMs: inline caching.
A Brief Primer on Inline Caching
Inline caching is an optimization often used in both statically typed and dynamically typed languages. An inline cache, or IC, is a set of instructions whose goal is to speed up operations like method calls and property lookups. It does this by taking a slow operation, like walking an object’s prototype chain and scanning through its named properties, and caches a fast path for subsequent lookups of that property on the same object type. If you’re curious about the inner workings of ICs, Explaining JavaScript VMs in JavaScript – Inline Caches by Vyacheslav Egorov goes into far more depth on ICs in JavaScript than I will here. Egorov, a Senior Staff Software Engineer at Google, currently works on the Dart programming language and previously worked on the V8 JavaScript engine.
ICs significantly improve the performance of property lookups when the VM always sees a single type of object. However, IC performance degrades as an operation becomes more polymorphic. As the VM encounters more types of objects for that operation, it triggers deoptimizations, switching to less efficient IC implementations. Today in V8, an inline cache essentially comes in three flavors:
- Monomorphic — The VM only ever observed a single type of object.
- Polymorphic — The VM observed between two and four types of objects.
- Megamorphic — The VM observed more than four types of objects.
Monomorphic ICs are the fastest, as they only need to compare the type identity of the current value to the one previously recorded in the cache. Polymorphic ICs are somewhat slower, as they must match the type identity of the value against a small number of potential targets. Megamorphic ICs are the slowest as the cache is moved to the heap, is a fixed size, and its contents can be easily overwritten. These are fairly gross approximations of actual IC behavior, so if you would like more detail on the subject I would encourage you to read What’s up with monomorphism?, also by Egorov.
The Slow Creep of Megamorphism
Many operations in the TypeScript compiler are megamorphic by nature. We have hundreds of different syntax tree nodes that represent the various syntactic productions in the TypeScript and JavaScript languages, and often need to branch based on node kind. In general, we might expect that once we’re in a branch for a specific kind of node, the ICs that the JavaScript VM creates should be monomorphic. However, that is not always the case.
Unfortunately, JavaScript polymorphism can be insidious. Two objects produced by the same constructor can still be
considered different “types” if those properties were initialized in a different order, or if some properties are only
initialized conditionally. Unfortunately, this was the case with many data structures in the TypeScript compiler. We
often had conditional assignments, such as assigning the symbol of a node only during binding, and assignments
occurring in varying orders based on which functions might be called first for a given node. This ends up leading to a
lot of unintentional polymorphism.
Example: Property Order Polymorphism
In the following example, the order in which properties are initially assigned in the object returned by f()
is different based on which branch of the if is evaluated. In g(), the p.x property access will become
polymorphic because it observes two different shapes: { x, y } and { y, x }:
function f(x, y) {
  if (x <= y) {
    return { x, y };
  }
  else {
    return { y, x };
  }
}

function g(p) {
  const x = p.x; // polymorphic
}

g(f(0, 1));
g(f(1, 0));
Example: Conditional Property Polymorphism
In this example, the property p.y is only defined conditionally in f(). As a result, the p.x property access in
g() will become polymorphic because it observes two different shapes: { x } and { x, y }.
function f(x, y) {
  const p = {};
  p.x = x;
  if (y !== undefined) {
    p.y = y;
  }
  return p;
}

function g(p) {
  const x = p.x; // polymorphic
}

g(f(1));
g(f(1, 0));
Recognizing Megamorphism
It can be fairly difficult to recognize megamorphism in a large JavaScript code base, and even more difficult to determine whether that megamorphism is negatively impacting performance. Overoptimizing infrequently used code paths wastes time and resources, so we needed tooling to help us analyze poorly performing code to find actual, tangible improvements that we could make. We built benchmarking tools to monitor compiler performance over time. We used CPU profiling and heap snapshots to investigate performance regressions. But these tools often didn’t give us the details we needed for fine tuning. So, for the past few years we’ve been working on a tool called Deopt Explorer that we’ve used internally to help us explore the various deoptimizations, ICs, and object types that V8 produces when the compiler is executing.
Introducing Deopt Explorer
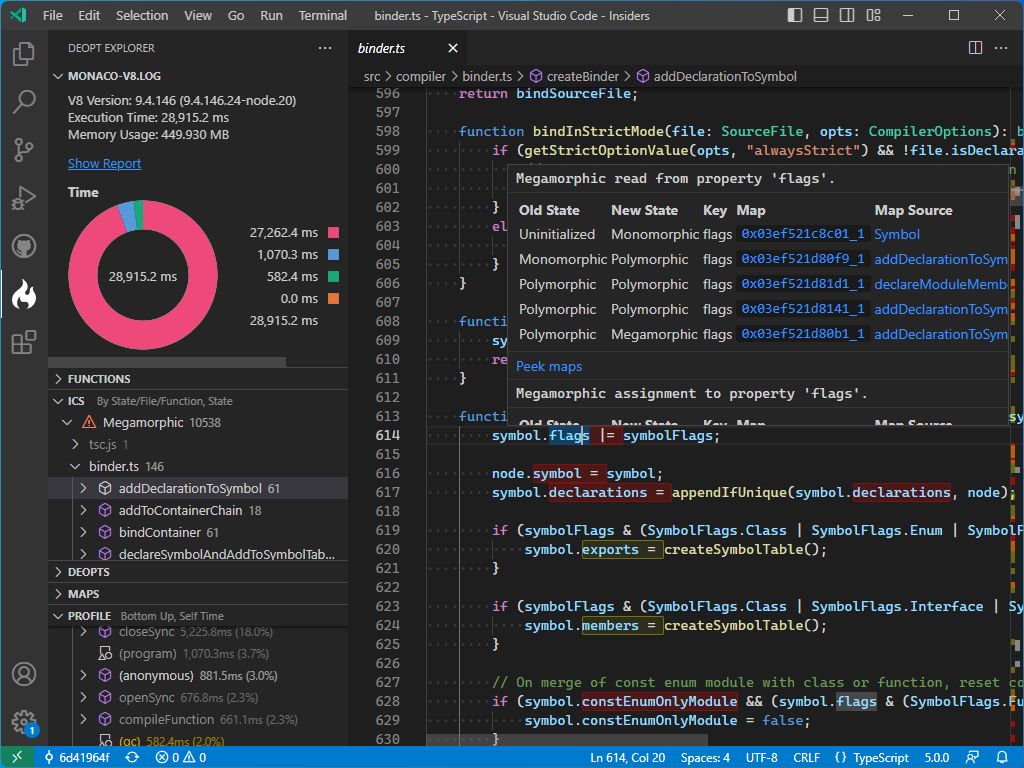
Deopt Explorer is a VS Code extension that can analyze trace logs produced by V8. It was heavily influenced by tools like Vyacheslav Egorov’s IR Hydra, and Thorsten Lorenz’s Deoptigate, and provides a detailed look at deoptimizations and ICs right from within the editor.
To explain how Deopt Explorer works, I will walk through how we used it recently
to improve compiler performance by making property accesses against TypeScript’s internal Symbol type monomorpic.
Generating a Log
To get started, we need to produce a V8 trace log that we can analyze. There are a number of V8-specific options that
control trace log output that are exposed by NodeJS. These options are known to change from release to release, so we
published a commandline utility called dexnode to make it easier to provide the
correct logging options based on the version of V8 embedded in the running version of NodeJS. dexnode can be invoked
from the commandline in place of the normal node executable, and we can use that to invoke the TypeScript compiler
against one of our test cases:
npx dexnode --out v8.log .\built\local\tsc.js -p .\path\to\project
Which is the equivalent of the following:
node --log-deopt --redirect-code-traces --redirect-code-traces-to=\\.\NUL
  --log-ic --log-maps --log-maps-details --log-code --log-source-code --prof
  --log-internal-timer-events --detailed-line-info --logfile=v8.log
  --no-logfile-per-isolate .\built\local\tsc.js -p .\path\to\project
This generates a file called v8.log that we can feed into Deopt Explorer.
Investigating ICs
After the log has been processed, we can expand the ICS tree view to get an idea of how polymorphic the code is in
binder.ts:
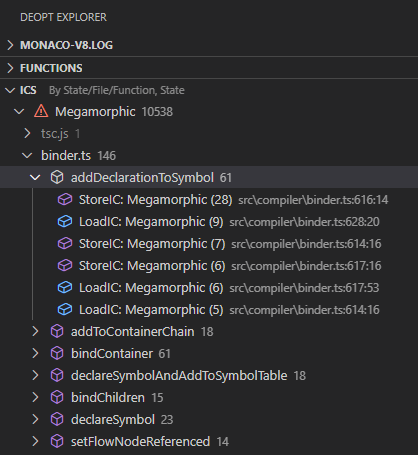
Given that there are quite a few megamorphic ICs, we’ll start by clicking on addDeclarationToSymbol to jump to that
function. This function is called by TypeScript’s binder for every variable, function, class, method, parameter,
property, etc., so it is invoked quite frequently. With the file open in the editor, Deopt Explorer will highlight ICs
and other deoptimizations using editor decorations, allowing us to easily pick out those that are megamorphic:
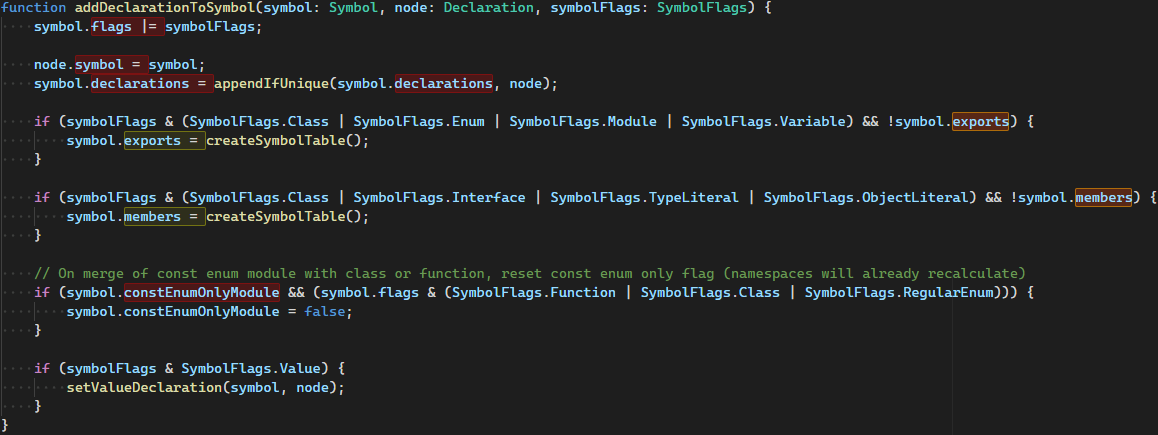
Here, megamorphic ICs are highlighted in red, while polymorphic ICs are highlighted in yellow. Immediately we can see
there are megamorphic ICs for symbol.flags, node.symbol, symbol.declarations, and symbol.constEnumOnlyModule,
meaning that each IC has observed multiple different maps for our Symbol and Node objects. Hovering over
symbol.flags gives us more context:
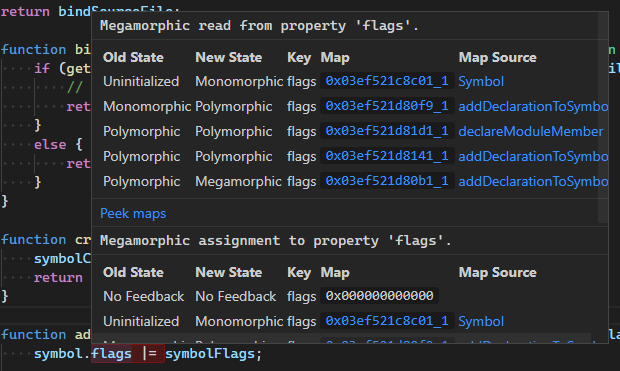
We can see that there were two different ICs associated with this statement, given that it is a compound assignment.
For a given IC, each line in the hover represents an IC event, and includes the current state of the IC (i.e., monomorphic,
polymorphic, megamorphic), the “map” associated with the event, and the source location where that “map” was defined. In
V8, a “map” (not to be confused with the JavaScript built-in Map) represents the type of an object, including its
properties, prototype, the constructor that produced it, and other related metadata.
TypeScript only has one kind of Symbol, so lets look at the V8 maps associated with the Symbol constructor to find
out where things went wrong.
Exploring V8 Maps
Expanding the MAPS tree view in Deopt Explorer shows the maps produced by V8, grouped by the constructor that produced
them:
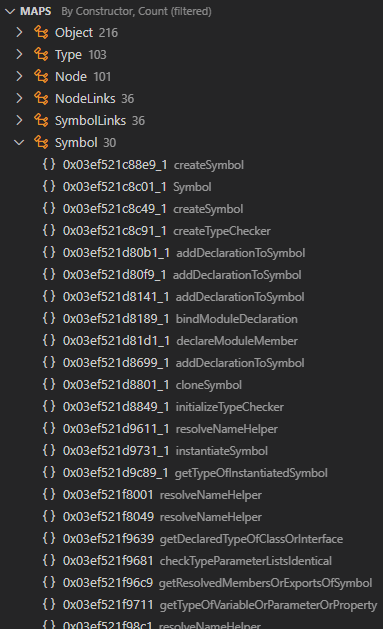
Expanding the constructor shows a list of each related map’s addresses, as well as a hint to the name of the function that introduced the property that produced the map.
V8 produces more than 30 different maps for Symbol, although Deopt Explorer will filter out a number of
inconsequential maps by default. The ones we see here are directly referenced by ICs, and, as we can see from the list,
come from far more places than the Symbol constructor itself. Clicking on the third map down (0x03ef521c8c49_1),
opens an editor showing the structure of the map:
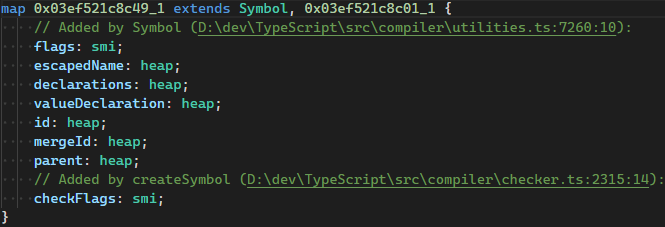
This view shows a number of useful pieces of information:
- The address of the map (
0x03ef521c8c49). - A counter (
_1) that is used to differentiate between two or more maps that existed at that address at different points in time, such as when a map is garbage collected and that memory is reused for a different map at a later time. - The constructor that produced the map (
Symbol). - An optional base map, from which this map was produced when a new property was added (or some other change occurred).
- A list of properties and their associated runtime types, such as
smiwhich is a V8 “small integer”, orheapwhich indicates a heap reference. This may also point to another V8 map.
The data structure is followed by a commented section containing a timeline showing how the map has evolved, as well as a section containing extra metadata provided by V8.
From within this view, you can Ctrl– or Cmd-click on various links to jump to related source code locations, use “Go to Definition” to jump to another map, or “Find all references” on map identifiers to see their associated ICs.
We can also see that checker.ts added a new property called checkFlags that wasn’t initialized in the constructor.
This means that symbols produced by the checker, which we call transient symbols, will have a different V8 map than
those produced by the binder. But that isn’t the only case.


Clicking on the first two addDeclarationToSymbol maps in the tree view shows us two different maps produced by the
same function: one that adds an exports property and one that adds a members property. This indicates that there
multiple conditional property assignments, which in turn leads to more maps.
Reducing Megamorphism
To make property accesses on Symbol monomorphic, we need to avoid these conditional assignments. This means ensuring
that the V8 map for an object is stable, and all properties are initialized to something. For properties we intend to
fill in later, this meant using undefined.
function Symbol(/*...*/) {
    // ...
    // Unconditionally assign to 'exports' and 'members':
    this.exports = undefined;
    this.members = undefined;
}
However, there is a trade off when you do this. The more properties you assign to an object, the more space those objects take up in memory.
For Symbol, reducing megamorphism wasn’t as simple as pre-initializing these optional properties because we create so
many symbols during compilation. In addition, symbols produced by our checker not only included all of the properties of Symbol, but all
of the properties of SymbolLinks, an internal interface we use to cache checker-specific information for symbols. We
did this initially for performance reasons. Symbols from the binder are reused during incremental parsing, so
checker-specific information is stored in a lookaside table. Since symbols produced by the checker aren’t reused, we
opted to store checker-specific information on the symbol itself to avoid the cost of an additional indirection. We
obviously don’t want to pre-initialize all of the SymbolLinks properties on Symbol, since that would cause our
memory consumption to skyrocket. Instead, we chose to add a single links property to Symbol in which we would
store the SymbolLinks object for transient symbols. This still requires indirection, but is far cheaper than reading
from a lookaside table because we can leverage a monomorphic IC when accessing the property.
Outcomes
After making these changes in microsoft/Typescript#51880, we
dramatically reduced the number of maps V8 produced for Symbol from thirty down to two:
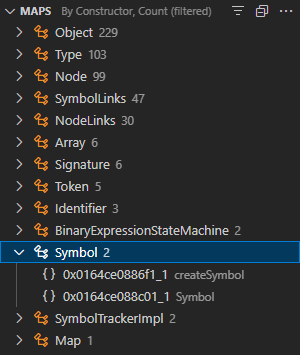
Even though this view shows two maps, only the second one matters as the first map is the empty object produced before
any properties are assigned. All property access against Symbol instances in the compiler are now monomorphic, and
between this change (3-5%) and improvements to monomorphism for
some of our Node subtypes (4-5%), we’ve reduced the average
compile time in our benchmarks by between 8-10%! And we’re not done yet as there are still many more opportunities to
reduce megamorphism that we’re still working on.
Getting Deopt Explorer
Deopt Explorer is available now in the VS Code extension marketplace. Deopt Explorer is also open source on GitHub, which is the best place to provide feedback and file issues, and PRs are welcome!


Thanks for the clear explanation and the wonderful extension! I’m curious about this quote:
> We built benchmarking tools to monitor compiler performance over time. We used CPU profiling and heap snapshots to investigate performance regressions.
Are these tools open source and if so where can I find them please?
The CPU profiling and heap snapshots were part of the benchmark tools? or you were running them only to debug regressions?
What an absolutely brilliant bunch of engineering to share with the community as an extension — thank you!