We are pleased to announce that the July 2020 release of the Python Extension for Visual Studio Code is now available. You can download the Python extension from the Marketplace, or install it directly from the extension gallery in Visual Studio Code. If you already have the Python extension installed, you can also get the latest update by restarting Visual Studio Code. You can learn more about Python support in Visual Studio Code in the documentation.
In this release we addressed a total of 51 issues, and it includes:
- Support for our new language server: Pylance
- Gather Extension
- Exporting notebooks to HTML and PDF
- Reverse connection for the debugger
If you’re interested, you can check the full list of improvements in our changelog.
Support for our new language server: Pylance
A couple of weeks ago we announced the release of Pylance, our new language server that is based on Microsoft’s Pyright static type checking tool.
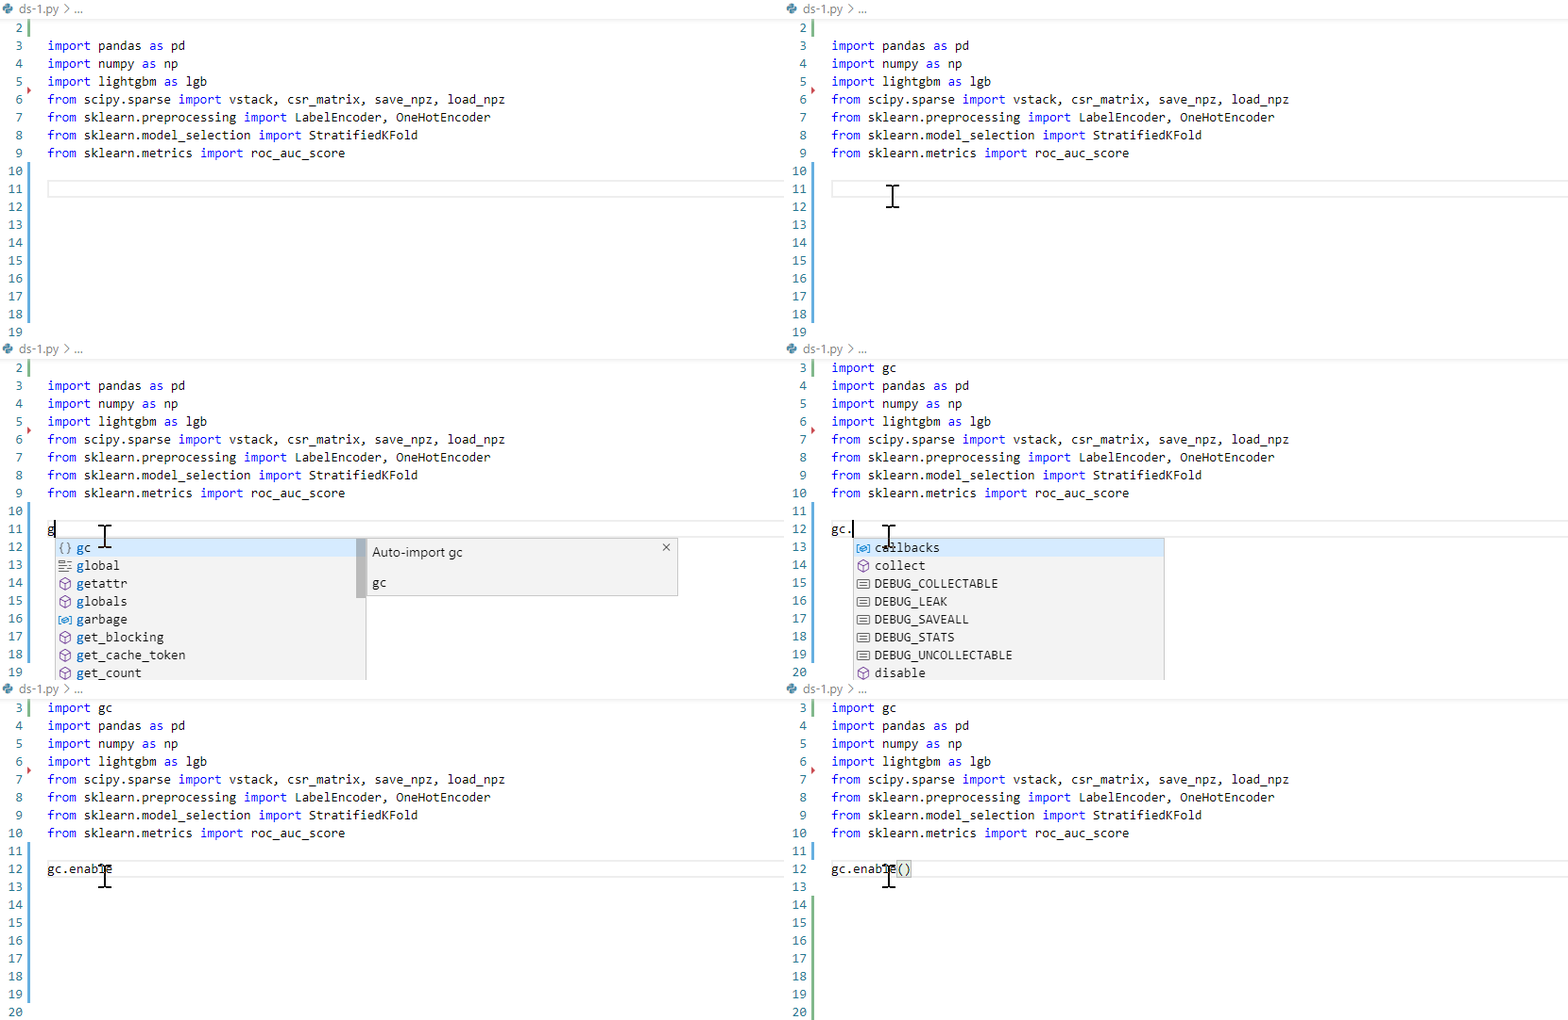
Pylance is a fast language server that provides many features to help you write your best code, including auto-imports, dead code detection, parameter and return type information, multi-root workspace support, and more. You can check out the Pylance release blog post to learn more about it.
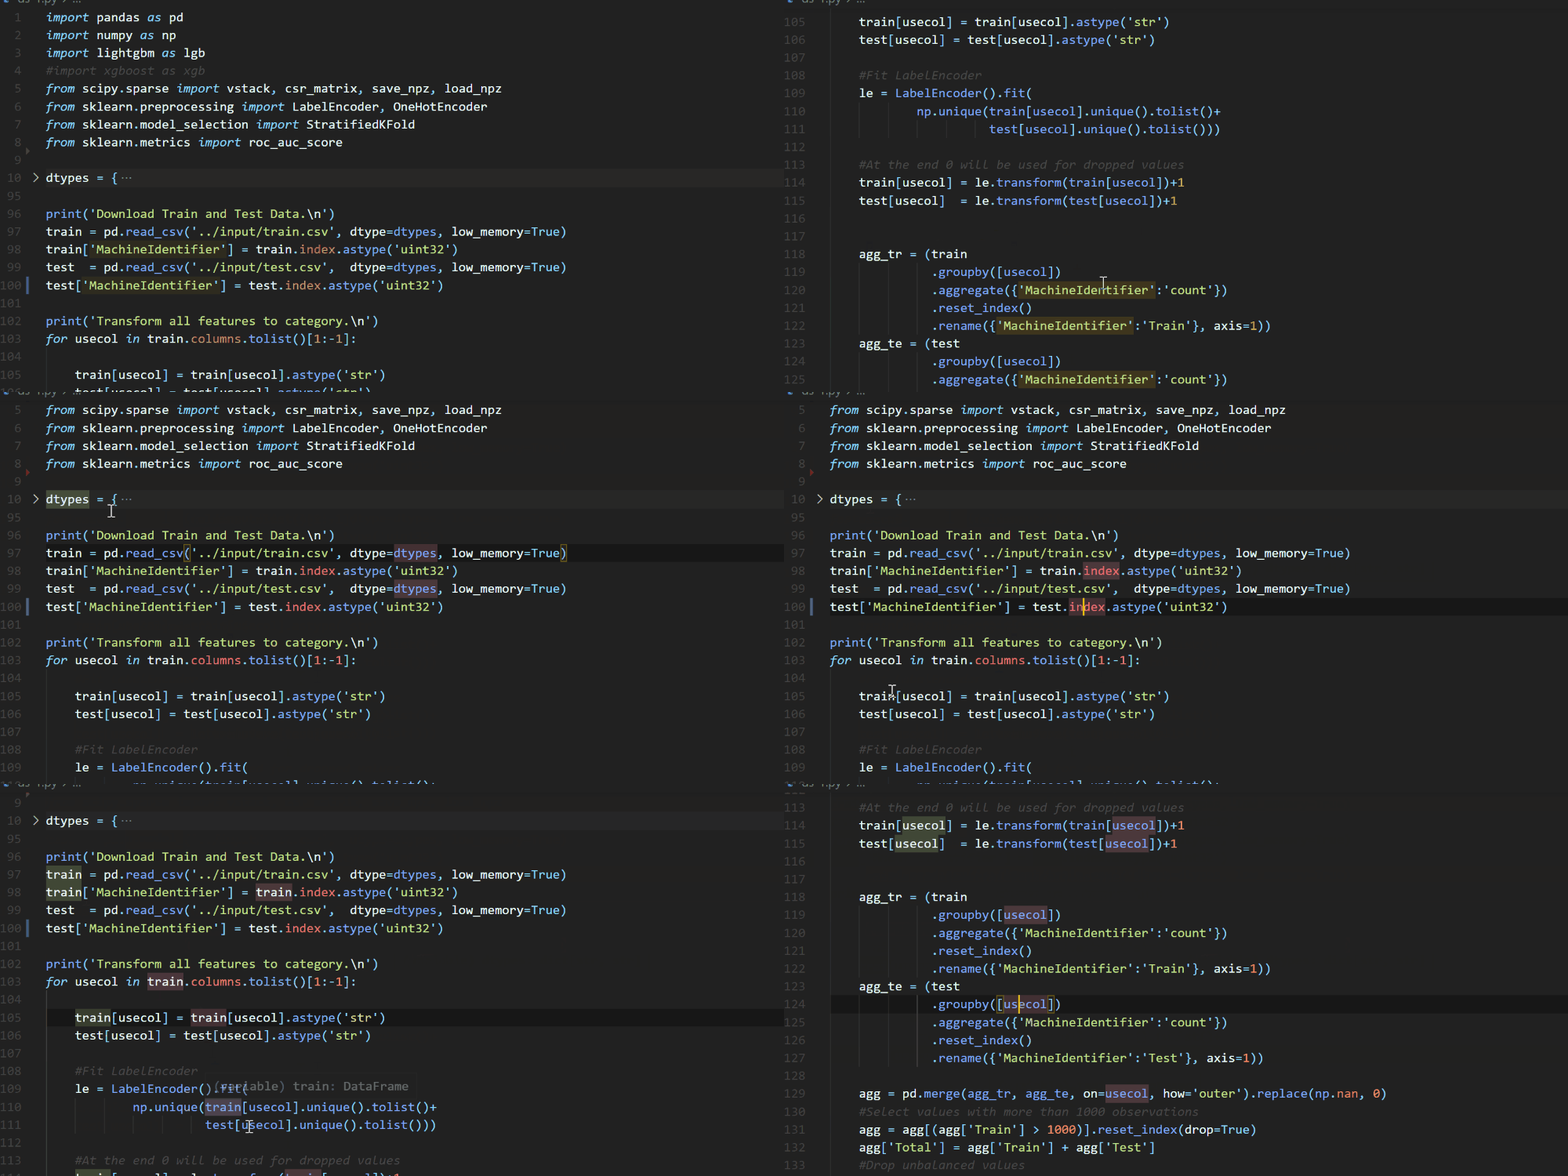
One feature that was recently added to Pylance is contextual highlighting, which helps you quickly identify where symbols are used in a particular file.
You can install the Pylance extension from the marketplace. If you have the Pyright extension installed, you should uninstall it in favor of the Pylance extension to avoid installation conflicts and duplicate errors and warnings, as all Pyright functionality is included in Pylance.
If you’re a Microsoft Python Language Server user, we suggest you try out Pylance. The new language server drastically improves Python IntelliSense in VSCode. Because of this, the long-term plan is to eventually deprecate and remove the Microsoft Python Language Server as a supported option in the Python extension.
Gather Extension
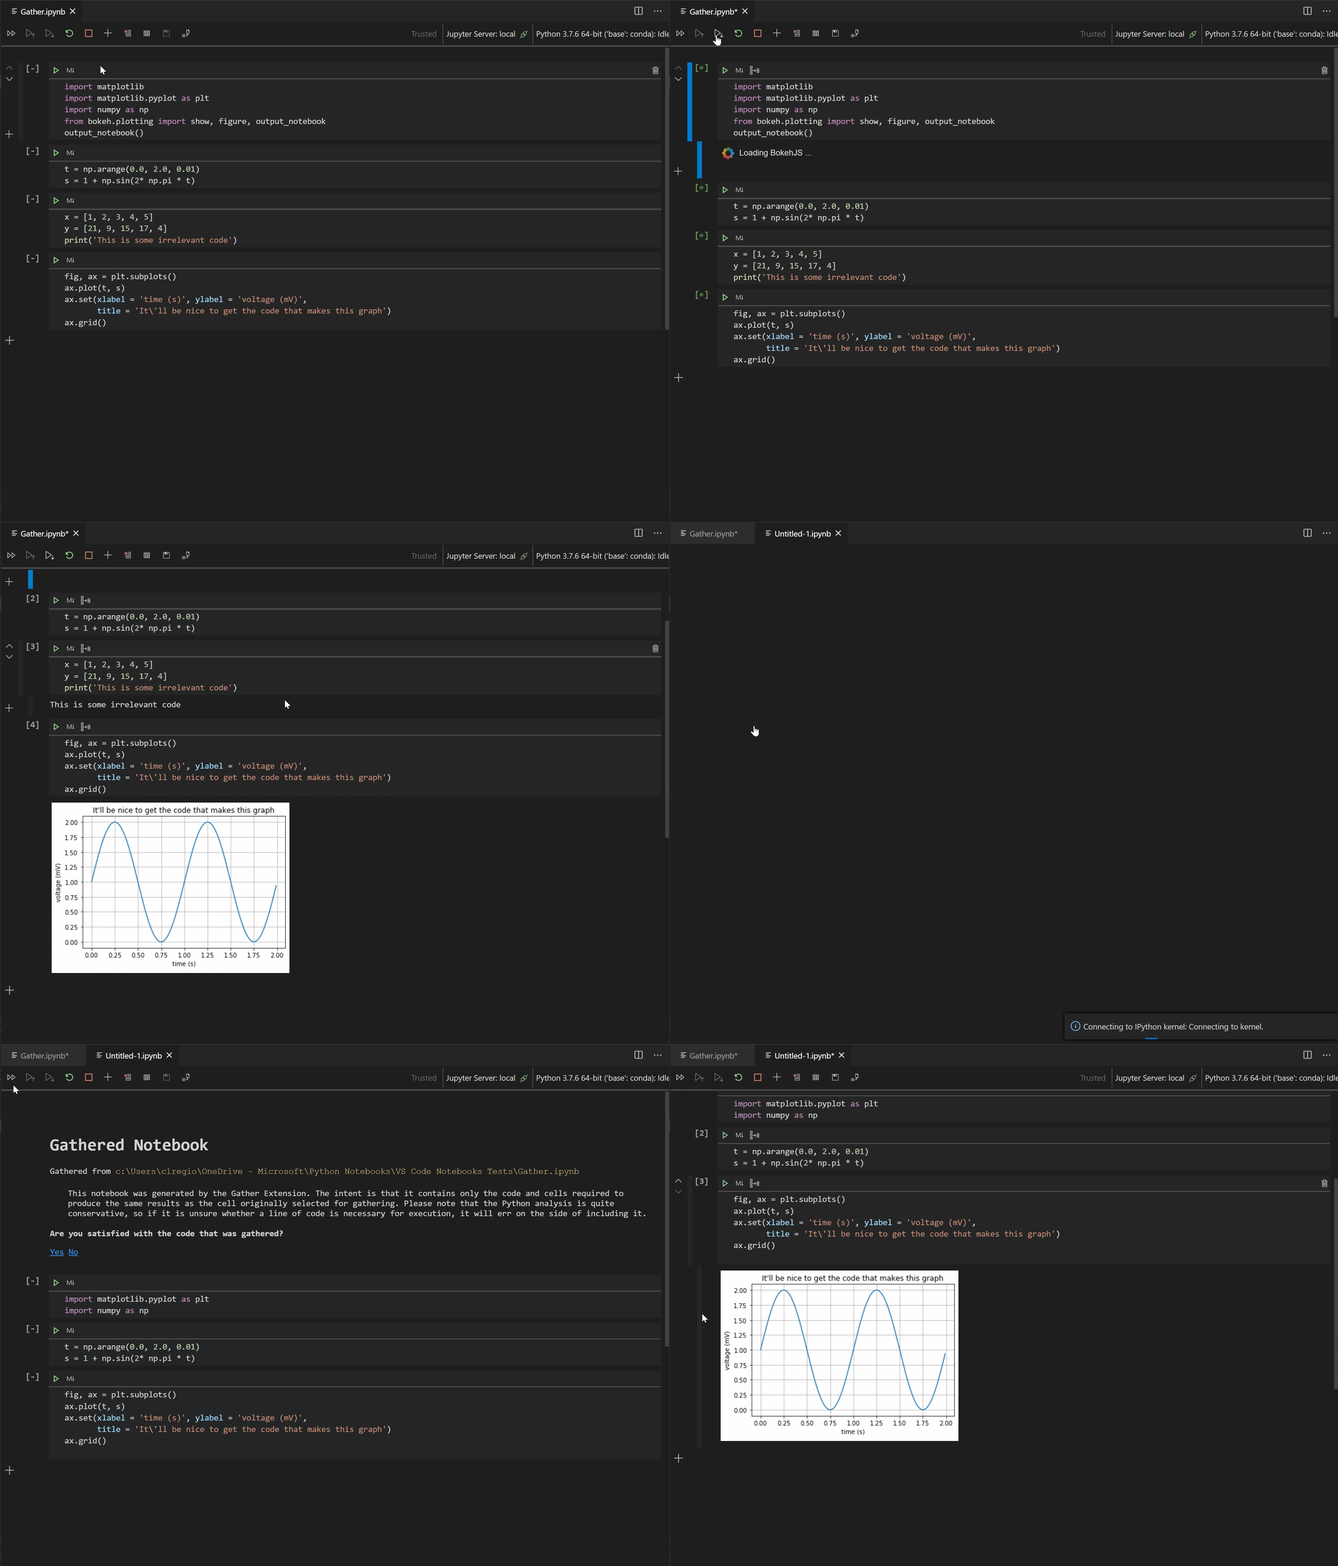
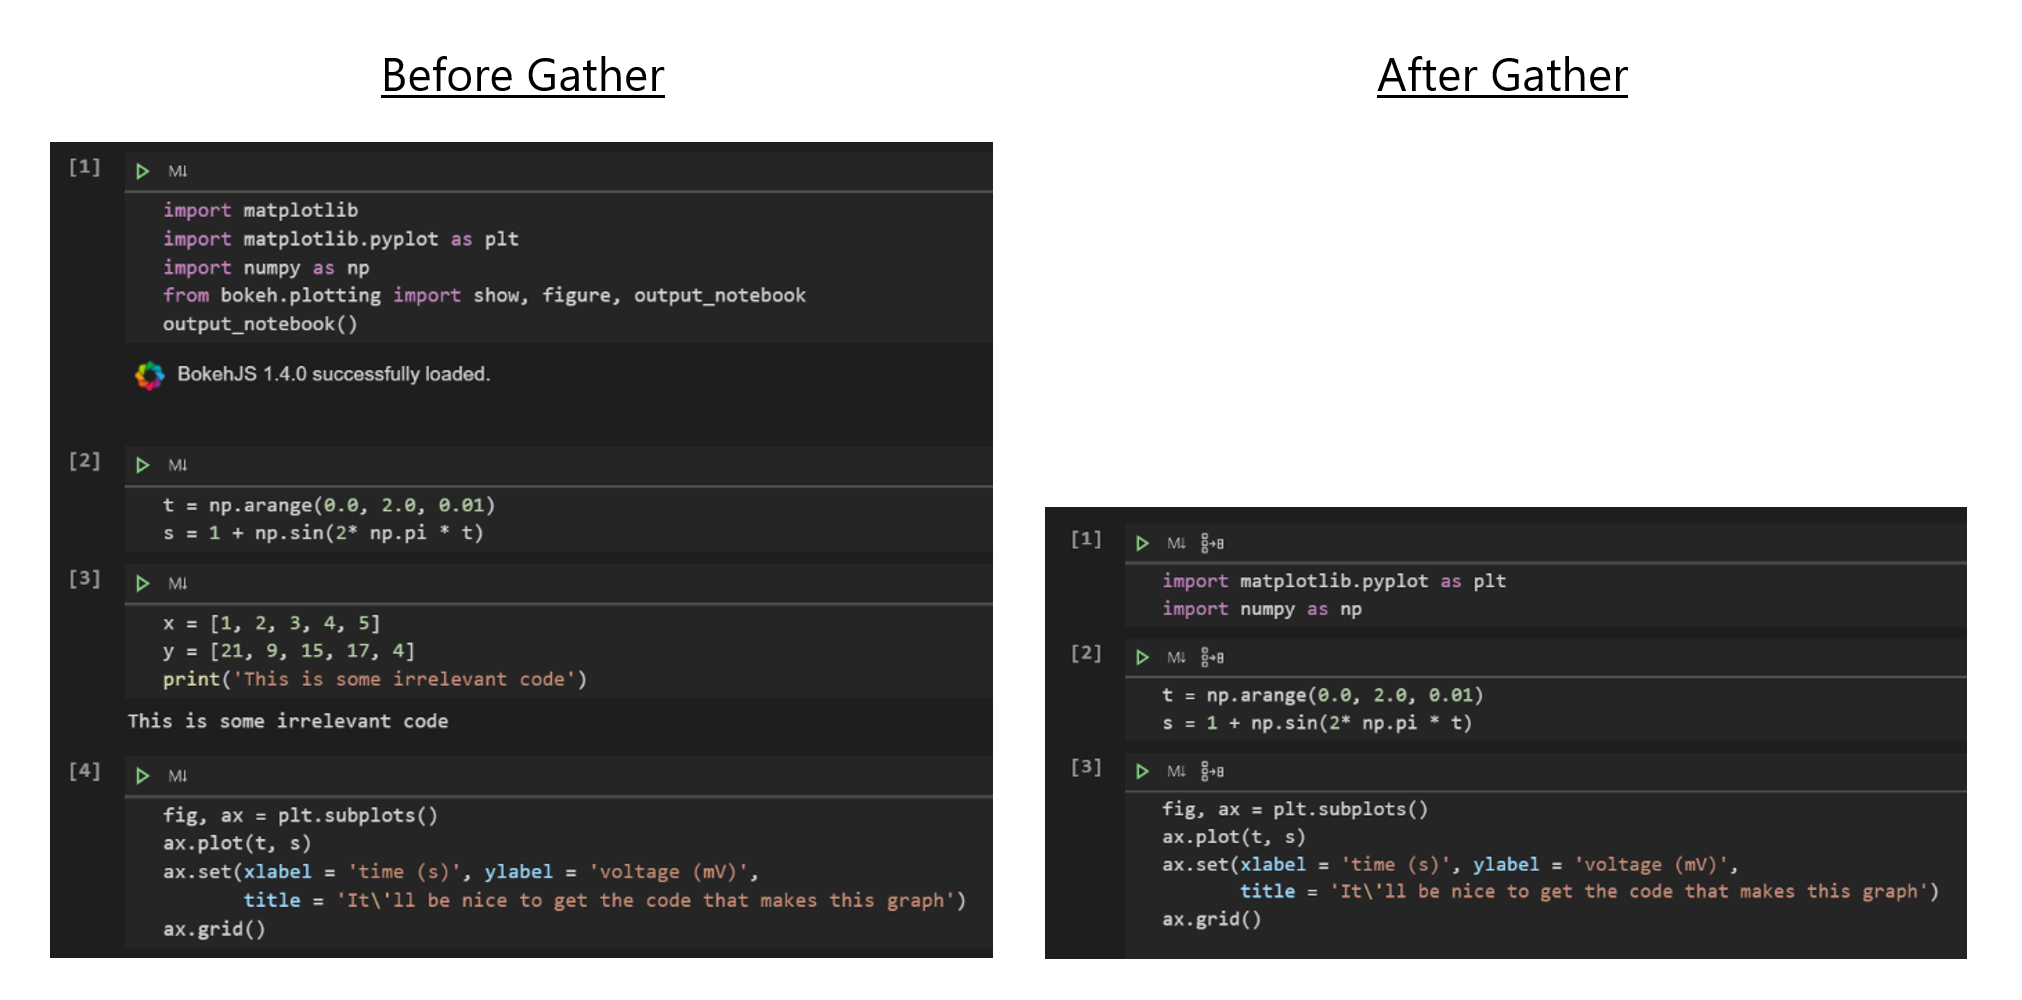
We’re happy to announce that this release adds support to our new experimental extension, Gather. Gather is continuously being iterated upon and we look forward to hearing feedback from the community to improve Gather’s accuracy! This tool analyzes and determines the necessary code dependencies within a notebook and performs code cleanup, thus automating this difficult and time-consuming task.
After running your cells look for the Gather icon ![]() in a notebook or Interactive Window and watch Gather collect and compile all of the dependent code used to generate that cell into a new notebook or script saving you time and effort! Forget having to manually remove unused imports or delete irrelevant code to get a cleaned up notebook. The final file format of Gather can be customized with the VS Code setting “Data Science: Gather To Script”.
in a notebook or Interactive Window and watch Gather collect and compile all of the dependent code used to generate that cell into a new notebook or script saving you time and effort! Forget having to manually remove unused imports or delete irrelevant code to get a cleaned up notebook. The final file format of Gather can be customized with the VS Code setting “Data Science: Gather To Script”.
You can install Gather today from the marketplace. We’d love to hear your feedback! If you have any issues, feel free to file them in the vscode-python GitHub repo.
Exporting Notebooks to HTML and PDF
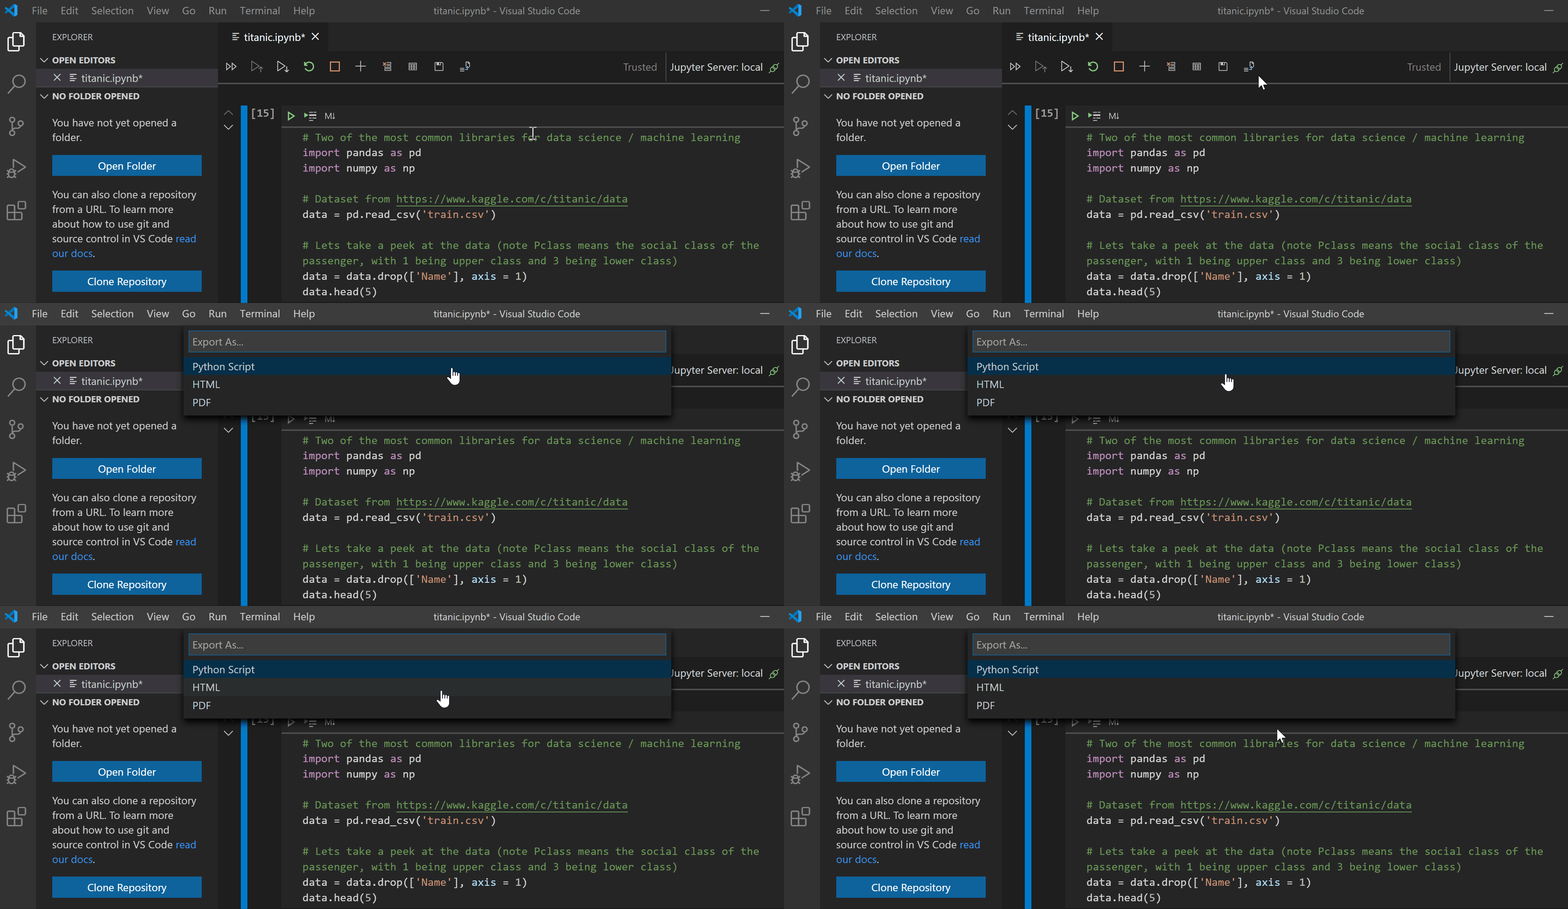
This release includes support for exporting notebooks to HTML and PDF, making sharing and presenting notebooks easier at the click of a button!
Please note that exporting to PDF requires installation of TeX.
Reverse connection for the debugger
With this release, you can now more easily start remote debugger sessions by using reverse connections.
When attaching ptvsd – our Python debugger in VS Code – to a Python process or to a remote machine, you would need to set up the remote Python process so it would listen to attach requests, and then start the debugger session in VS Code to attach to it.
However, attaching can be tricky if you don’t get timing right – maybe the process took long to start in the remote machine, or maybe it timed out waiting for the VS Code to connect to it.
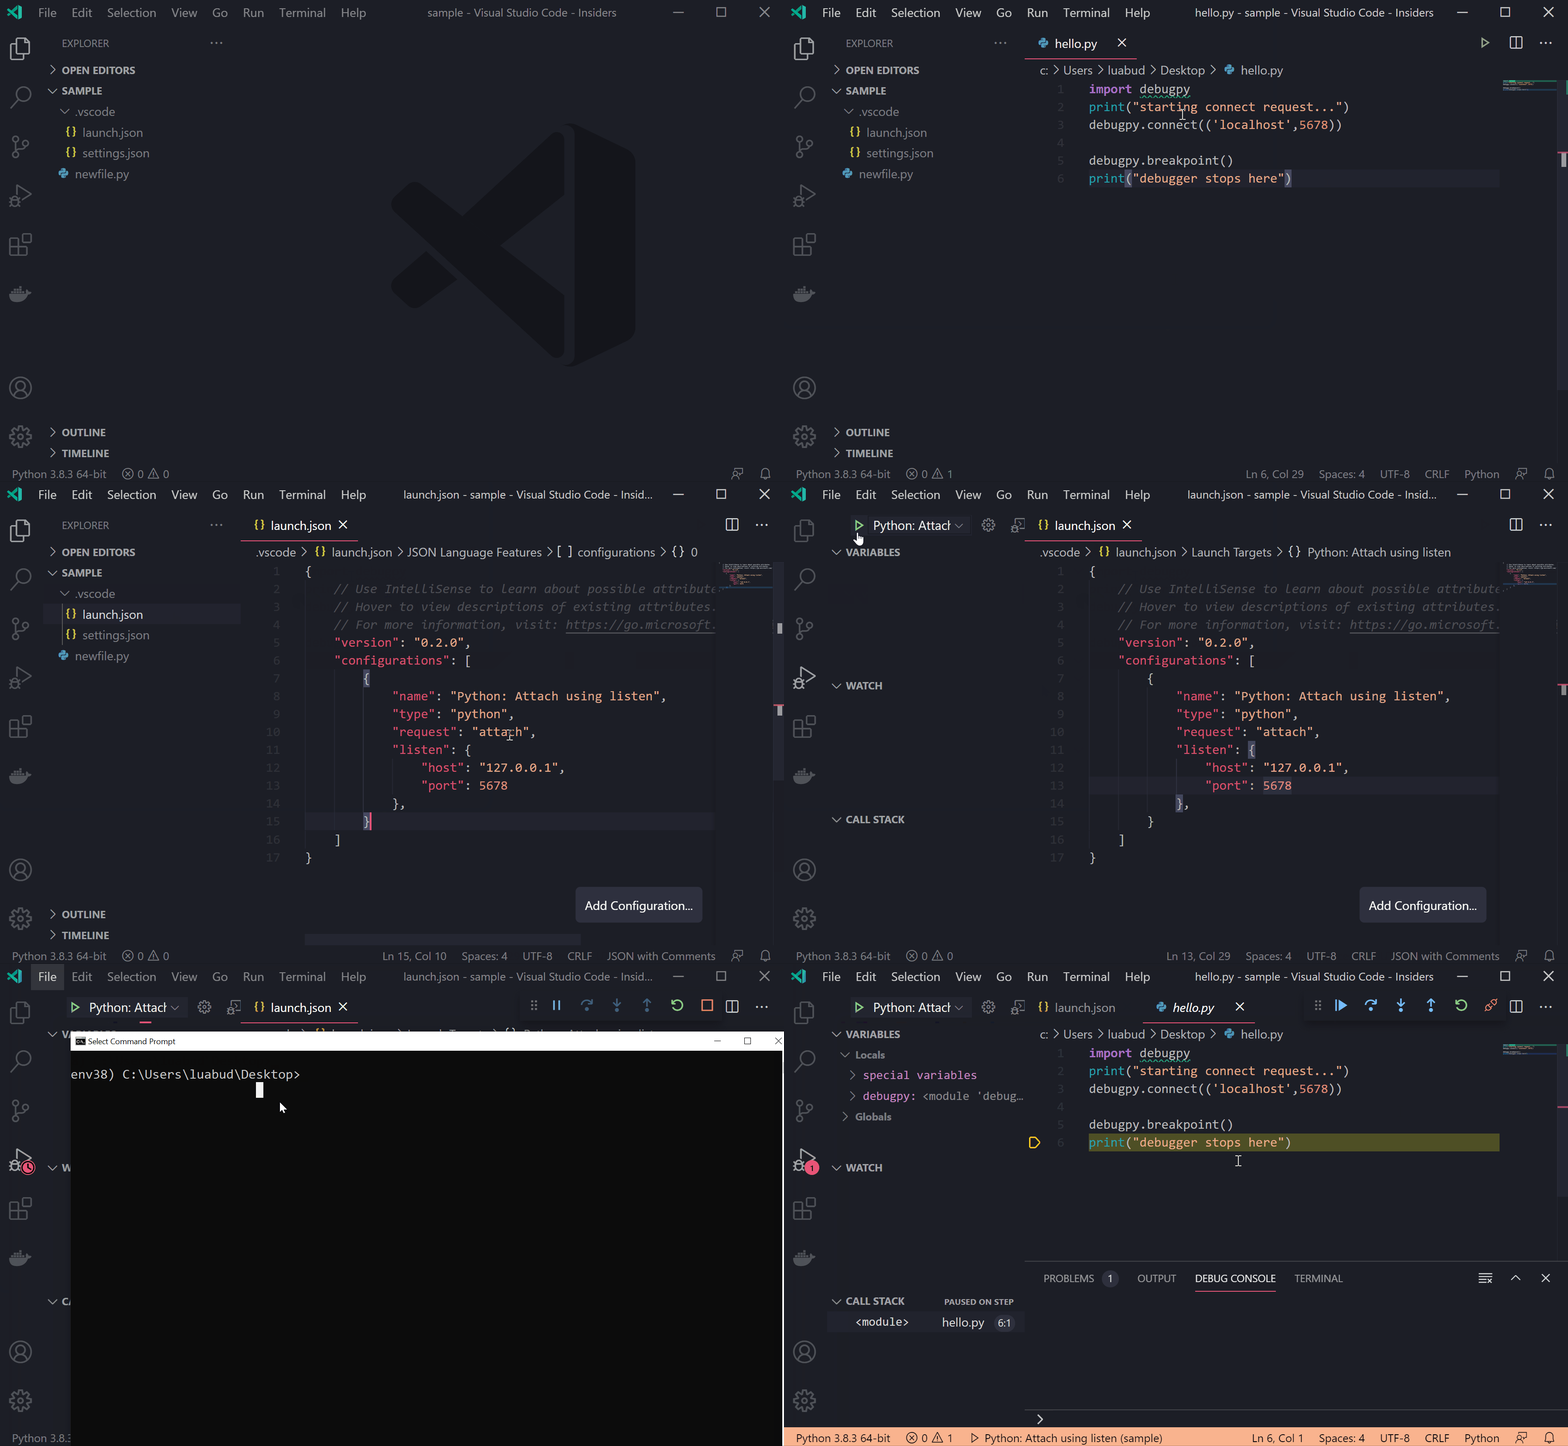
In this release we added support for configuring the debugger for reverse connection. You can now set up the remote Python process to connect on a specific address (port number or a host and port tuple), and run an attach configuration in VS Code to start listening on that same address, so it can attach to the process.
For example, you can run the following script:
     import debugpy
     debugpy.connect(('localhost',5678))

     debugpy.breakpoint()
     print("debugger stops here")
And then add a launch.json configuration in VS Code with the following content:
     {
          "name": "Python: Attach using listen",
          "type": "python",
          "request": "attach",
          "listen": {
                "host": "127.0.0.1",
                "port": 5678
          },
     },
Now you can start the debugger in VS Code so it starts listening for the connection request. When you start the Python process, it will stop on the defined breakpoint.
Other Changes and Enhancements
We have also added small enhancements and fixed issues requested by users that should improve your experience working with Python in Visual Studio Code. Some notable changes include:
- Support connecting to Jupyter hub servers Use either the base url of the server (i.e. ‘https://111.11.11.11:8000‘) or your user folder (i.e. ‘https://111.11.11.11:8000/user/theuser). Works with password authentication. (#9679)
- Added ability to configure whether to expand arguments passed to the debugger. (#11678)
- Updated to jedi 17.1. (#12486)
- Automatically activate the extension if a toml file is present in the workspace root directory (thanks @BrandonLWhite!) (#12056)
We’re constantly A/B testing new features. If you see something different that was not announced by the team, you may be part of the experiment! To see if you are part of an experiment, you can check the first lines in the Python extension output channel. If you wish to opt-out of A/B testing, you can open the user settings.json file (View > Command Palette… and run Preferences: Open Settings (JSON)) and set the “python.experiments.enabled” setting to false.
Be sure to download the Python extension for Visual Studio Code now to try out the above improvements. If you run into any problems or have suggestions, please file an issue on the Python VS Code GitHub page.

Hi there! I am missing a piece go information that i believe i have previously seen on your blog. It’s something like “@%%” you type on top of your code to either execute/degub the block only, not the entire code. Could you please refresh my memory. Thanks in advance.
Hi Igor!
When working with a Python script you can use #%% to run/debug the block.
You can find additional documentation on this feature here: https://code.visualstudio.com/docs/python/jupyter-support-py
Hope this helps 🙂
bravo