Reed Robison shares techniques to collect diagnostic data and automate recovery behavior with Azure App Services.
Troubleshooting production systems is often a balance between restoring services quickly and trying to collect enough information to isolate what caused the issue. For complex application issues, it’s almost always helpful to capture a memory dump. Memory dumps are a snapshot of a process in time and with them, you can see precisely what your app was doing when it experienced a problem. By examining call stacks, you can see exactly what every thread is doing – what they are waiting on, exceptions that were thrown, and sometimes even the data that is responsible for getting it into a bad state. Post-mortem debugging isn’t for everyone, but for the most complex problems it’s how you get answers. Luckily, there are some good tools that automate dump analysis, and you can always call Microsoft for deeper assistance.
The biggest challenge is typically reacting fast enough to capture a dump while the problem is occurring. Once you recycle a process, that data (and opportunity) is gone. Sometimes manual memory dumps are possible but frequently you must automate the process in order to get the data you need.
Azure App Services provides a range of Diagnostic Services to choose from. This post will explore some of the tools available and ways to automate more complex scenarios.
Let’s consider the scenario where a web application instance gets into a “bad” state and is no longer serving requests property. Requests routed to this one instance fail, but the other instances seem to be working fine. The goal is to quickly detect the condition, create a memory dump, and recycle only the instance that is causing problem.
Manual Intervention
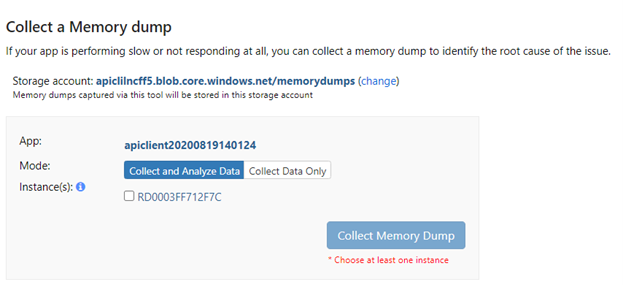
You could simply restart the App Service either through the Azure portal or through an automation script. The downside with this approach is that it restarts all the instances, and the impairment will persist until a human gets involved. That’s not ideal for production scenarios. To capture a dump before you restart, you can to navigate to the Diagnose and solve problems in the Azure portal and choose Diagnostic Tools. Choose Collect Memory Dumps, pick a specific instance to dump, then save to a designated storage account for further analysis.

Trapping a Specific Exception Condition
Frequently, there is a specific exception or condition responsible for getting your app into a bad state. For example, you might see evidence of exceptions that occurred at some point a memory dump or log file, but understanding how you go there means trapping the exception as it occurs. This can get tricky with multiple instances since you may not know which instance the error will occur on. In this scenario, you want to monitor the process for an exception to occur and trigger a memory dump at that moment in time. To do this with App Services, we’ll typically use something like procdumphelper to setup an exception monitor and configure the monitoring rule via Kudo console.
There a good overview of how to set this up here.
Tip – when configuring a rule to dump on a specific exception, you need -g if you are triggering on native exceptions. If you are triggering on managed exceptions, remove the -g param (will not trigger managed exceptions if this is used).
Automating Rules
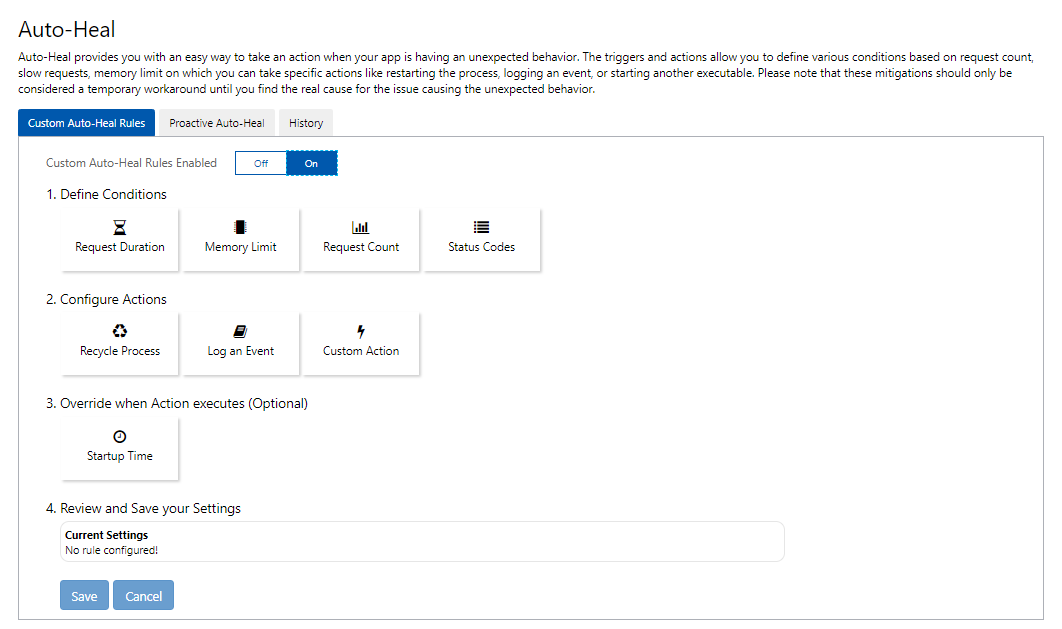
App Services allows you to define Auto-Heal rules to automate some types of recovery actions. You can configure these using the Azure portal under Diagnose and solve problems. The list of pre-defined conditions is limited, but it’s easy to use and handy for some common scenarios.
For instance, you can trigger this action based on Request Duration, Memory Limit, Request Count, or a specific Status Code returned from your app. You can choose to Recycle Process, Log an Event, or take a Custom Action (such as creating a memory dump, running a profiler, or even running a specific executable).

While Auto-Heal rules make it easy to automate against these conditional triggers, you don’t have a lot of additional options to customize them. In the scenario where you need to quickly identify a problem instance, dump it, and restore service, the default conditions (request duration, memory, count, or a status code) might not be enough. If your app could return a specific error code as a response, you could use that as the trigger, but that assumes your app knows it’s in a bad state and has the ability to return a unique status code to serve as a trigger. That may not always be possible.
Another automated option to restore service is Health Check. It allows you to specify a path in your application to ping on a regular interval. The idea here is that if an instance fails to respond to a ping it can automatically be detected as unhealthy and removed from the load balancer. If it remains in an unhealthy state for an extended period of time, it is replaced with a new instance. More details can be found here. It does not (yet) provide any means to debug or dump that problem instance and it doesn’t remove it right away.
If all the above approaches don’t provide the granularity to achieve the goal, you could consider writing your own automation script to control the actions. Azure exposes the ability to setup an alert rule (see Monitoring option in your app service) to trigger off a variety of conditions like Metrics and Logs. If there are characteristics (for example a Handle Count > threshold) that indicates a “known” bad state, you can configure an action group to kick off an Azure Function, Runbook, Logic App, etc., where you could control what happens next. If you can identify a way to trigger some kind of notification, then you can use PowerShell to author your own actions. There are a variety of ways to enumerate resources in your environment and take actions to restart services, instances, and even create memory dumps.
For example, here is a PowerShell script to recycle a role instance of a WebApp. You could use this technique to recycle a specific, problem instance vs. restarting the entire App Service.
I’ll go into details of some approaches of automating memory dumps via PowerShell and Azure REST APIs in the next post. You can use a combination of these techniques to fine tune an automated response to create memory dumps and quickly recycle problem instances.

0 comments