


Windows Performance Analyzer (WPA) is one of the most powerful tools available for understanding system performance on Windows. It helps engineers investigate Event Tracing for Windows (ETW) traces across CPU, memory, disk, networking, scheduling, input, and many other areas of the operating system.
That power also comes with complexity. A single trace can contain a huge amount of data, and finding the right signal often requires knowing which WPA tables to open, which columns matter, how to filter the right time range, and how to connect multiple pieces of evidence into a root cause.
We are working on WPA MCP as an Early Preview feature to make that workflow easier and more approachable.
What is WPA MCP?
WPA MCP brings GitHub Copilot CLI into the WPA trace-analysis workflow. Instead of starting every investigation by manually navigating graphs and tables, you can ask questions about the trace in natural language. WPA MCP helps GiHub Copilot translate that intent into trace-data exploration, summarize relevant findings, and guide follow-up analysis.
GitHub Copilot can inspect available trace data based on the prompt & identify relevant tables and signals and provide an analysis that helps you decide where to look next.
Why we are building it
Performance analysis is often bottlenecked by expert knowledge. Experienced WPA users can move quickly, but new or occasional users may not know where to begin. Even experts can spend significant time correlating activity across views before they reach a useful conclusion.
WPA MCP is intended to reduce that friction. It :
- Start investigations with plain-language questions.
- Find relevant WPA tables, graphs, and time ranges faster.
- Identify expensive CPU activity, call stacks, input delays, regressions, and other symptoms.
- Ask follow-up questions without restarting the investigation.
- Move from trace exploration to actionable insight more quickly.
An additional advantage is that you can use this for repetitive investigative workflows if your trace contains the same context. Download the latest preview version of WPA with MCP and use AI for trace analysis.
Current Early Preview support
The current Early Preview release supports GitHub Copilot only. Users need an active GitHub Copilot subscription to use WPA MCP. Other AI assistants, model providers, and MCP clients are not supported in this preview release.
Because this is an Early Preview, the user experience, supported scenarios, setup requirements, and feature behavior may change before general availability.
How it works
The Early Preview workflow is designed to fit GitHub Copilot CLI into WPA without replacing the existing analysis experience:
- Open a trace in WPA.
- Select the GitHub Copilot button in the upper-right corner of the WPA window.
- Use the Copilot pane to ask a trace-analysis question.
- Review the generated analysis and supporting signals.
- Continue with follow-up questions to narrow the investigation.
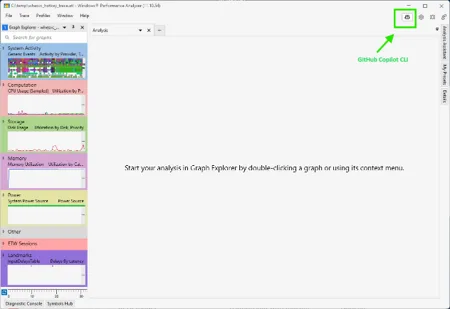
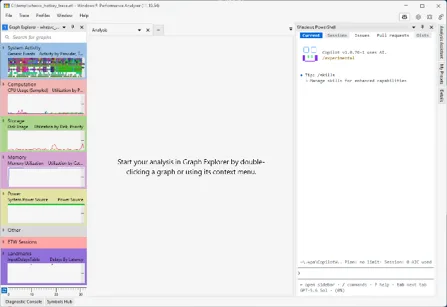
Example analysis flow
Start with a detailed prompt that describes the issue, including the observed symptoms, affected time range, and relevant user or system activity. Providing this context helps the LLM focus its investigation and produce a more relevant trace analysis.
Sample prompt below
Analyze this trace and tell me why the machine was slow. Prioritize evidence that explains perceived slowness such as hangs, delayed input response, long ready times, CPU starvation, disk bottlenecks, memory pressure, paging, service contention, and problematic drivers. Use the trace to distinguish between system-wide bottlenecks and activity isolated to a single app or service and create a digestible report based on the insights you received from the trace.
After the initial response, then can continue with more focused questions based on the output.
- Which processes contributed most to the delay?
- What call stacks were most expensive during the affected time range?
- What evidence supports that conclusion OR Which tables supports this conclusion
- Was the system CPU-bound, blocked on I/O, or waiting on another resource?
This conversational workflow does not remove the need to inspect the trace. Instead, it gives users a faster way to form hypotheses, find relevant evidence, and decide where to focus next.
More examples on Microsoft Docs
Note
As part of responsible AI safeguards, the MCP may request permission to access text or JSON files it generates. This experience will continue to evolve as new features are added.Settings
With the release of WPA-MCP, we also have a set of new settings to add more support for the WPA MCP. You can access these Settings from the File Menu or from directly from the startup launcher screen.
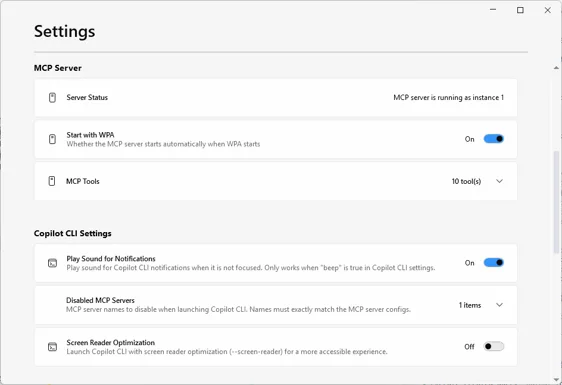
MCP server
- Server status – Provide information about the WPA MPC status.
- Start with WPA – Controls whether WPA MCP starts automatically when GitHub Copilot CLI launches inside WPA. This setting is on by default. If disabled, start the server manually by entering /MCP and selecting WPA-MCP from the list of available MCP servers.
- MCP tools – Provides a read-only access to the list of tools that WPA MCP uses to query the trace data.
Copilot CLI Settings
- Play sound for Notifications – Simple as the title, it plays a sound when GitHub Copilot CLI is not in focus when enabled in the GitHub Copilot CLI settings.
- Disabled MCP Server – Improve GitHub Copilot CLI startup performance by disabling MCP servers that are not needed for WPA investigations. Since WPA loads Copilot CLI with your configured MCP servers, disabling unused servers reduces startup time and reduce the noise in the context.
- Screen Reader Optimization – This setting is to provide parity with screen reader optimization settings in GitHub Copilot CLI
Important notes about LLM-generated analysis
WPA MCP uses large language model capabilities through GitHub Copilot. LLM-generated responses can vary between runs and may be incomplete or incorrect. Users should treat Copilot output as an assistant-generated starting point, not as a final diagnosis.
Before taking action based on a result, users should validate the findings against the underlying WPA trace data. Review referenced tables, graphs, time ranges, processes, threads, and call stacks, and ask follow-up questions when the evidence is unclear.
What we want to learn during Early Preview
The goal of the Early Preview is to learn where AI assistance provides the most value in real WPA investigations. We are especially interested in feedback on prompt quality, trace-analysis accuracy, useful follow-up workflows, missing scenarios, and places where Copilot should expose more supporting evidence.
This preview is an early step toward making advanced Windows performance diagnostics more accessible, more scalable, and faster for a broader set of WPA users. Please provide feedback using the button besides the GitHub Copilot button or via Feedback Hub (WIN + F) under Settings > Start Menu.
Closing
WPA MCP is designed to help users spend less time searching through trace data and more time understanding what the trace is telling them. We are excited to share this Early Preview and continue improving the experience with feedback from Windows performance


0 comments