Fluid Framework is a platform for building distributed, collaborative web apps that sync data in real time. Fluid saves developers from having to reinvent the wheel to solve the data sync problem, but developing and debugging Fluid apps can still be challenging, especially when dealing with complex data structures and many concurrent users.
That’s why we created Fluid DevTools, a browser extension (available for Edge and Chrome) that lets you inspect and manipulate Fluid containers and DDSes (Distributed Data Structures) within them when running your web app. Fluid DevTools give you a powerful tool to troubleshoot and test your Fluid app, as well as to learn more about how Fluid works under the hood. In this blog post, we will show how you can use Fluid DevTools to understand what Fluid is doing behind the scenes, and to troubleshoot a web app as you write it.
Fluid DevTools is part of Fluid Framework 2, which is currently in Preview with general availability coming this summer. For questions, feedback and feature requests, please reach out to us on GitHub.
A quick overview of Fluid DevTools
Fluid DevTools can help you with the following tasks:
- Shared data inspection – Inspect the contents of DDSes (such as SharedTree) in your Fluid containers.
- Audience inspection – Look at the Fluid container’s Audience, the list of Fluid clients that are connected to the container.
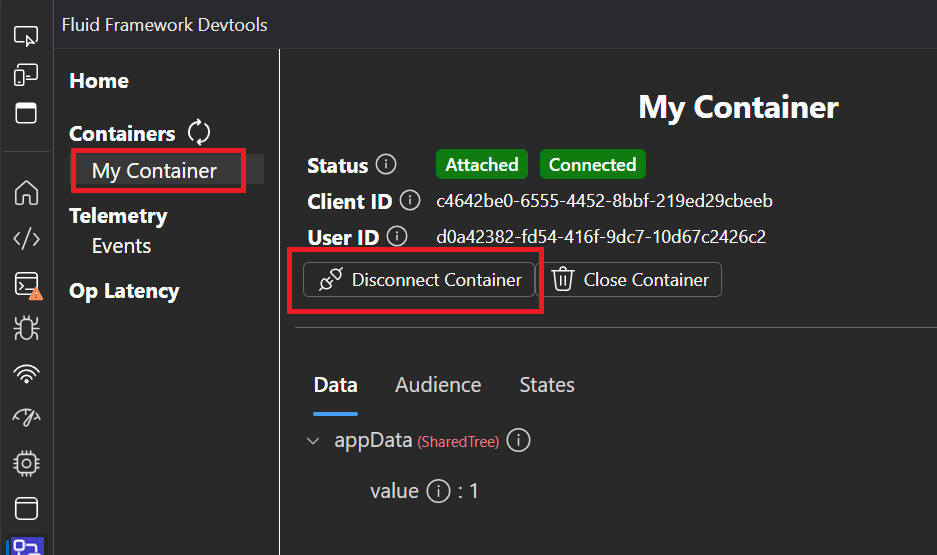
- Container state manipulation – Manually force a disconnection/reconnection of the container, to see how your app code reacts to those scenarios.
- Framework Telemetry – Look at telemetry generated by the framework for a deeper understanding of events.
- Metrics visualization – View op-related metrics such as network latency, and time spent in outbound/inbound processing.
In the future you will also be able to manipulate the DDSes from within Fluid DevTools. Stay tuned for that!
Installing and setting up Fluid DevTools
The first thing to do is install the browser extension (for Edge or for Chrome). You only need to do this once. Browsers will usually auto-update the installed extensions so you will always have the latest version.
Then you need to configure your Fluid-based app to leverage Fluid DevTools. This will usually mean adding a few lines to your existing code:
- Call the createDevToolsLogger function to get a logger that DevTools can use to get Fluid telemetry from your app.
- If you’re already using a logger, you will wrap it in this step.
- Once you have created or loaded the necessary Fluid containers for your app, call the initializeDevTools function passing the containers and the logger from the previous step.
This will look something like this:
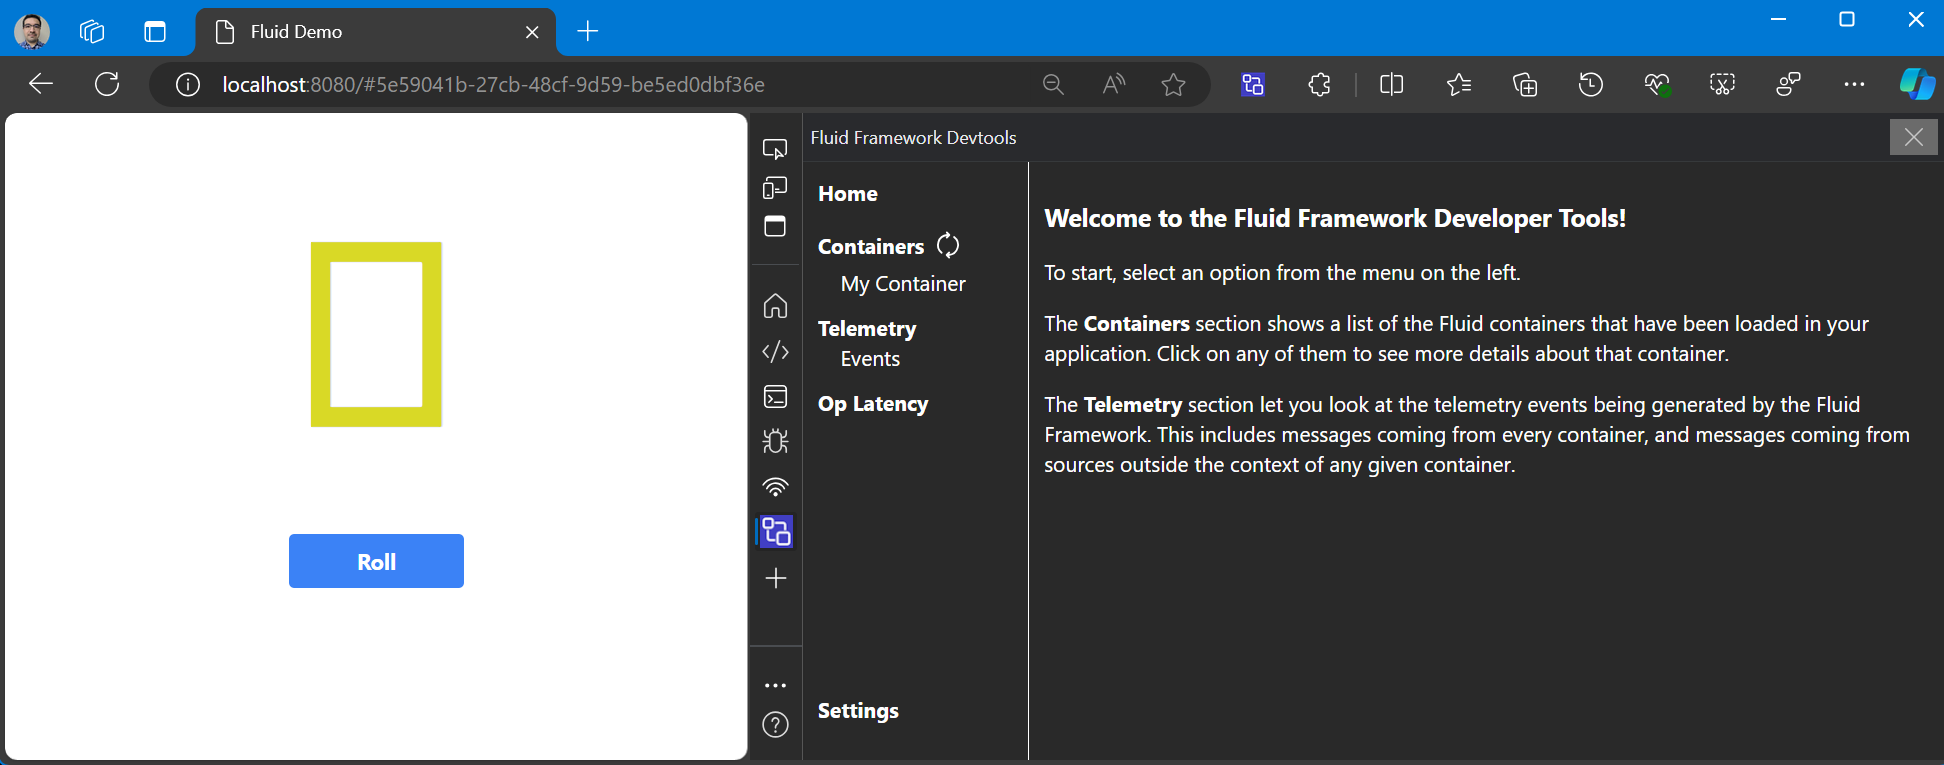
Now start your app and navigate to it in the browser, open the browser’s DevTools panel, and click on the icon for Fluid DevTools:

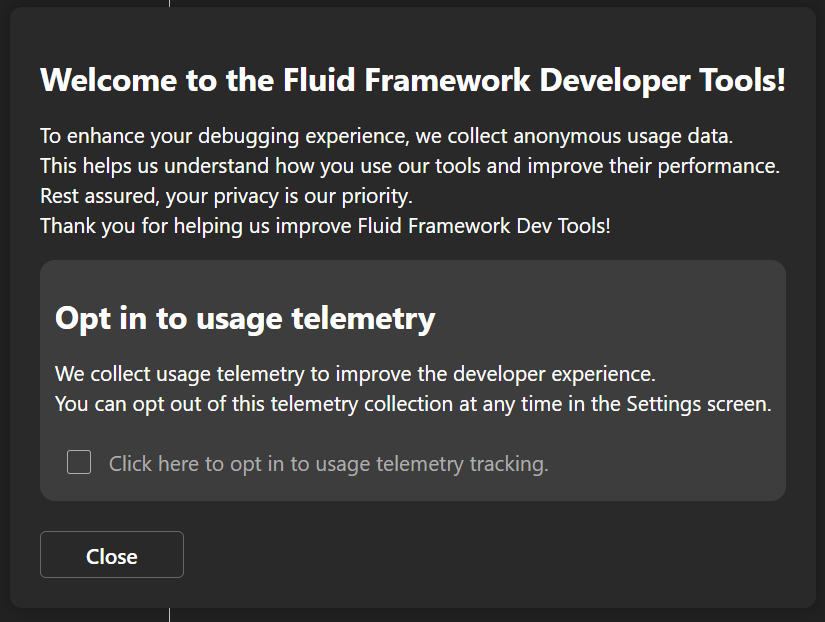
Optionally, you can opt in to share usage telemetry. It’s completely anonymous and only tells us which parts of the Extension are the most useful. It will help us improve Fluid DevTools!

Using Fluid DevTools to troubleshoot a web app
Let’s now see how we can use Fluid DevTools to investigate issues in a web app.
The sample app I’m using is a simplified version of this example in the Fluid Framework repository. It displays a die and a button to roll it. It uses a simple SharedTree data structure with a ‘value’ property that stores the current value of the die. It looks like this:

But wait a second, the die is not showing correctly! It should look like the face of a six-sided die, with dots on it. Let’s have a look at the data inside the Fluid container to see if we can find any clues. On the left menu, under “Containers”, click on the container you want to inspect. They are listed based on the unique identifiers you provide when initializing Fluid DevTools. In this case I used “My Container” as identifier. After clicking the container, the “Data” tab displays the Fluid data inside it:

So far everything looks good but hovering over the information icon next to “value” (this is the field I defined in my SharedTree), I see that the data being stored in it is a string, when my app needs it to be a number for the rendering logic to work. And indeed, my SharedTree is currently set up to store a string.

Once I update my schema to store a number and fix some other places to account for that, the application renders correctly and I can confirm that the data stored in the Fluid container has the correct type.

Now, I see a problem when a second client connects to the same Fluid container. When I roll the die in the first client, the change is reflected in the UI instantaneously in that client but takes some time to be reflected in the other one; and if the die is rolled in the second client, there’s a delay before the UI is updated there, and as soon as it updates there it also updates in the first client at the same time.
The video above showcases another feature of Fluid DevTools, the Op Latency chart (operations or “ops” are the basic unit of change that Fluid operates on; for more details see the documentation). For each Op the current client submits to the service, the chart gets a new data point that tells you how much time it took for the op to be processed by the framework (both before being sent to the Fluid service and after it came back) and how much time it spent “in network” (i.e. being transmitted to/from and processed by the service). This can help you identify if delays in your application are caused by network latency and/or Fluid code.
What we see in the Op Latency chart in the video suggests that all ops are taking pretty much the same amount of time (in the order of milliseconds) getting processed by Fluid (including processing and network time). The delay seems too big to be related to these times, so once again it looks like the issue might be in the application code.
A bit of investigation reveals an interesting behavior: on a client that loads an existing container (in the video, the top client created the container, and the bottom client loaded it once it already existed) a lot of time is spent processing an event emitted by Fluid when the die value changes, delaying the UI update. That explains why the UI changes instantaneously on the top client when the die is rolled there but takes some time to change on the bottom client; and why when rolled on the bottom client, the UI takes some time to update there, but once it does the change is reflected on the top client immediately.
For this demo, we deliberately introduced a delay (lines 12-16) to demonstrate this type of problem.
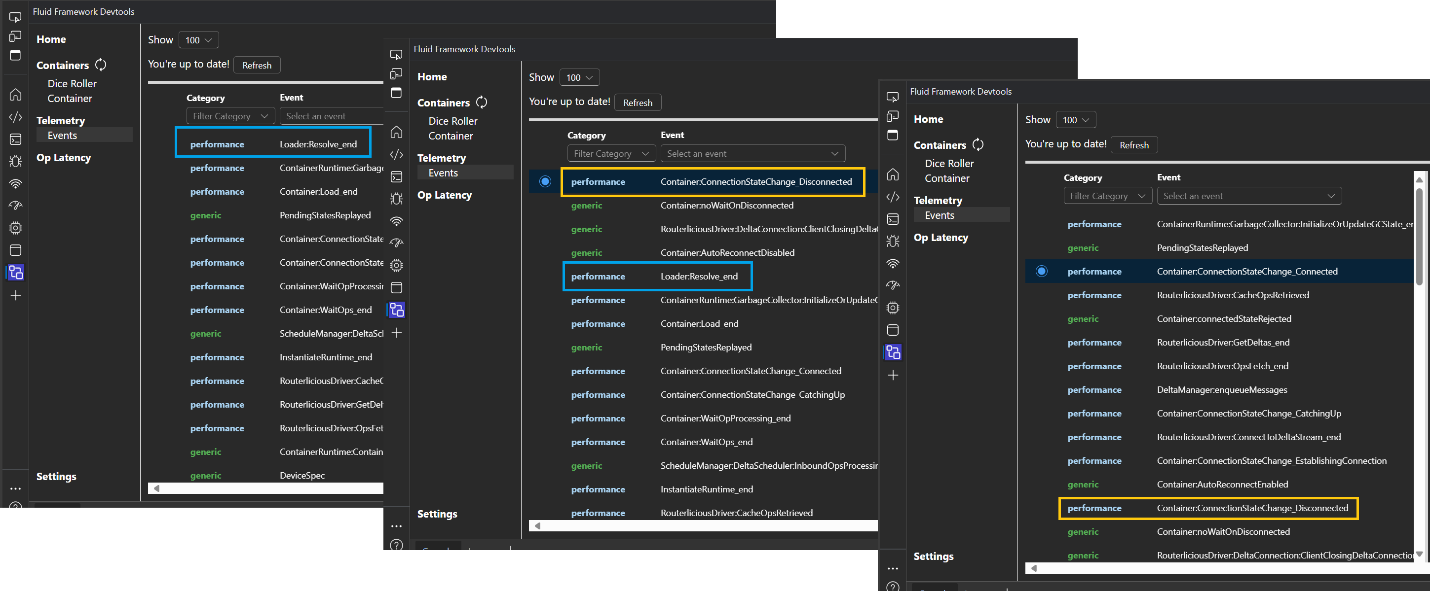
If you’re interested in knowing more about what’s happening behind the scenes in Fluid Framework, you can use the Telemetry -> Events section to look at all the internal telemetry it generates. The following image shows it changing as I manually disconnected and reconnected the Container, also using Fluid DevTools (the Disconnect/Reconnect button in the Container’s details page).


The telemetry data displayed in DevTools can give you some insights into what’s happening in the framework. If you are running into issues and need help, you can engage with us on Github and share some of this data. Fluid DevTools only displays the telemetry information within the extension and will only keep a limited number of events in memory. However, you can use the @fluidframework/app-insights-logger package to create a logger that you can pass into to Fluid so that all generated telemetry gets forwarded to an Azure Application Insights instance you own. You can also use Application Insights as a persistent store for your telemetry and it allows for better querying and analysis of the events as necessary.
Conclusion
In this blog post we described how to install the Fluid DevTools browser extension and how to configure your application to leverage it, and then showcased several of its features and how they can help you troubleshoot issues when developing a web application. We looked at the Fluid data visualizer, the Op Latency chart, the telemetry viewer (as well as how to send telemetry to Application Insights), and how you can manually disconnect/reconnect a Fluid container.
Visit the following resources to learn more:
- Get Started with Fluid Framework 2.0
- Sample app code using SharedTree and SharePoint Embedded
- For questions or feedback, reach out via Github
- Connect directly with the Fluid team, we would love to hear what you are building!
- Follow @FluidFramework on X (Twitter) to stay updated


0 comments