

In the previous post, I introduced some of the new features in Microsoft Teams Toolkit v3 to empower enterprise Teams developers. In this article, I will show you the improved local debug experience in the Toolkit and new features introduced in version 3.4.
First, you need to install the Teams Toolkit extension in Visual Studio Code or update it to the latest version if you already have it. And if this is the first time interacting with Teams Toolkit, I recommend going through the step-by-step tutorial, Get started with JavaScript on Microsoft Teams developer platform documentation first.
⌨️Debugging with “F5”
Debugging, casually referred to as F5 (function key) among developers, is one of the key features of Visual Studio Code, and this built-in debugger helps accelerate your edit, compile, and debug loop. Teams Toolkit uses the VS Code feature to let you run your app in Teams client and debug it during the development.
To enable local debugging in Teams Toolkit, first, make sure you are logged in with your M365 account under the Accounts section in Toolkit. Then:
- On VS Code, go to the Run and Debug view in the Activity Bar
- Select either Debug (Chrome) or Debug (Edge) from the dropdown menu on the debug button and click the ▶️ (Start) icon
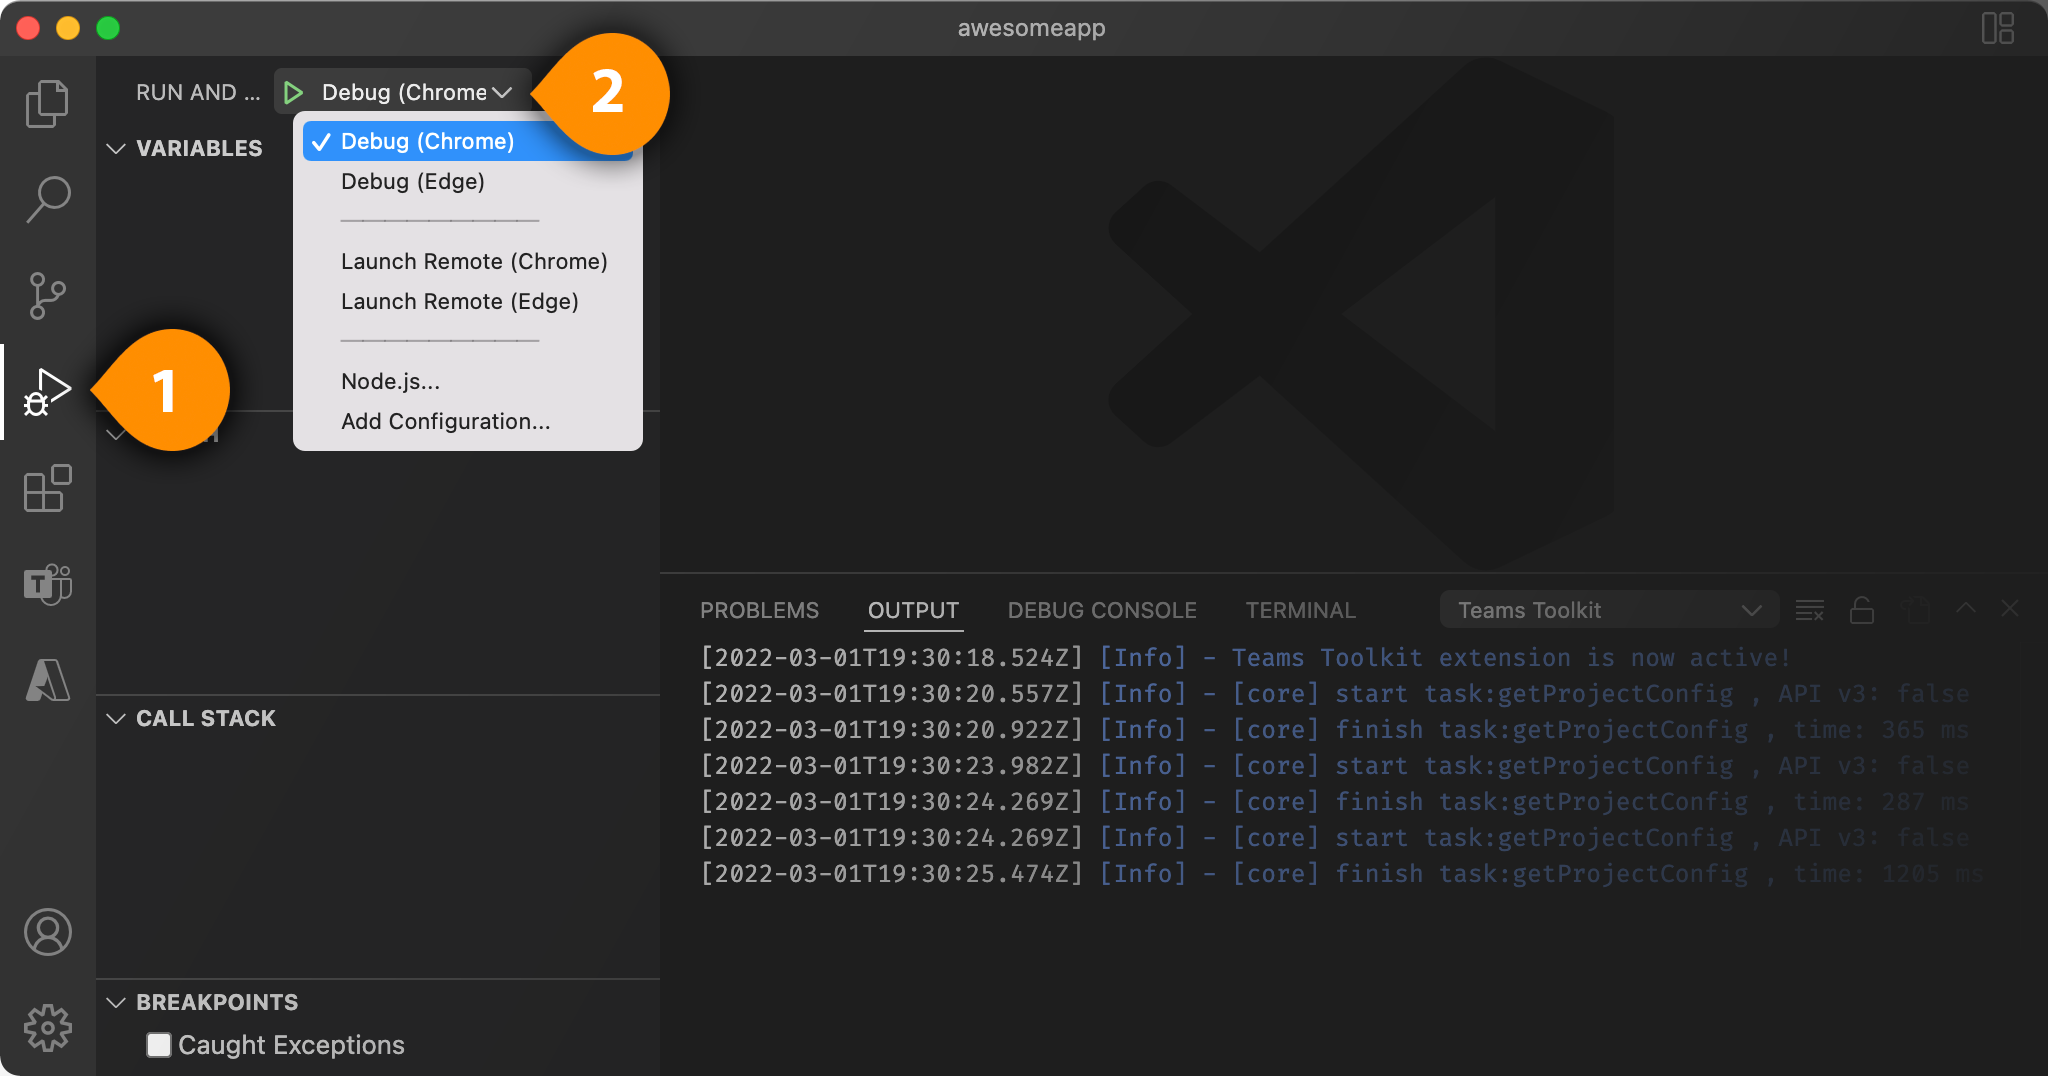
Alternatively, you can just press F5 function key on your keyboard.
Toolkit will launch Teams client in a new Chrome or Edge browser, where you can add your app.
⚠️ If this is the first time with Teams Toolkit, you will be prompted to confirm to add an SSL certificate. Please agree to continue. Since Teams requires https Tab hosting endpoint, a localhost development certificate will be automatically generated and installed to your system after your confirmation.
📍 Using Breakpoints
Breakpoints in VS Code is also available in the Toolkit to debug your code for tab, bot, message extension, and Azure Functions. You can toggle the breakpoints while your app is running on Teams client on browser.
Click the left margin next to the line you wish to stop so the breakpoint will appear as a red dot 🔴. Then run the code (F5).
Your code will pause before the marked execution.
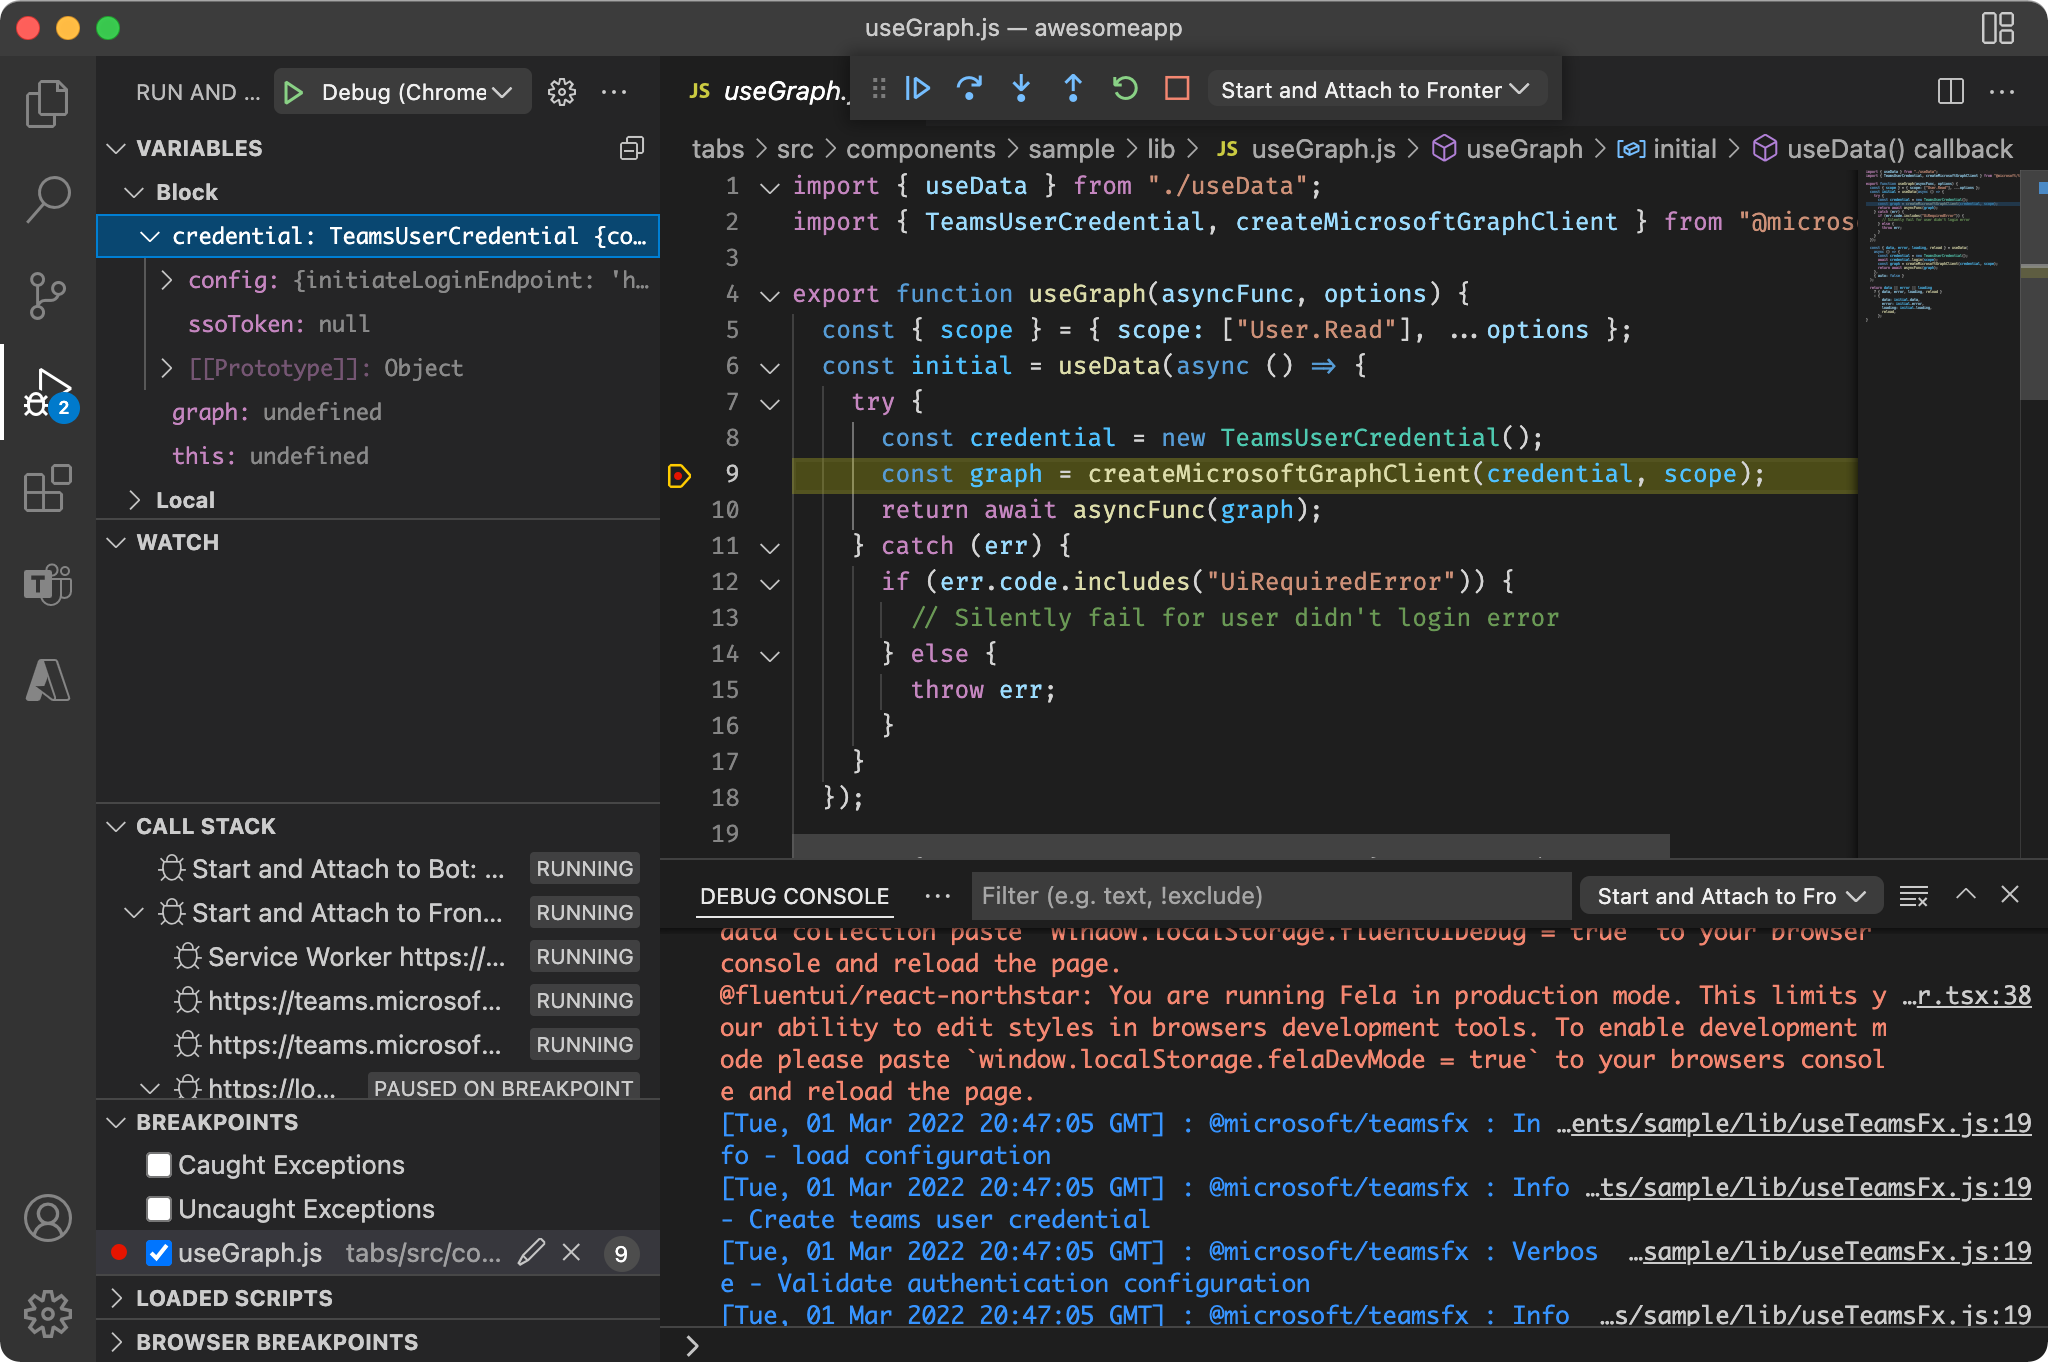
Once a debug session starts, the Debug toolbar will appear on the top of the editor:

- Continue / Pause
F5 - Step Over
F10 - Step Into
F11 - Step Out
⇧F11 - Restart
⇧⌘F5 - Stop
⇧F5 - Multi-target debug
The last action in a dropdown menu is for selecting a multi-target debugging. In Teams Toolkit, selecting “Attach to Frontend” (for tabs) or “Attach to Bot” (for bots and messaging extension) will trigger a Node.js debugger, as well as Edge or Chrome debugger to launch a new browser instance and open a web page to load Teams client. “Attach to Backend” will start a Node.js debugger to attach to the Azure functions source code.
Also note that Hot reload is enabled in the Toolkit so you can just update your code and save the changes, then your app will automatically reload and re-attach the debugger.
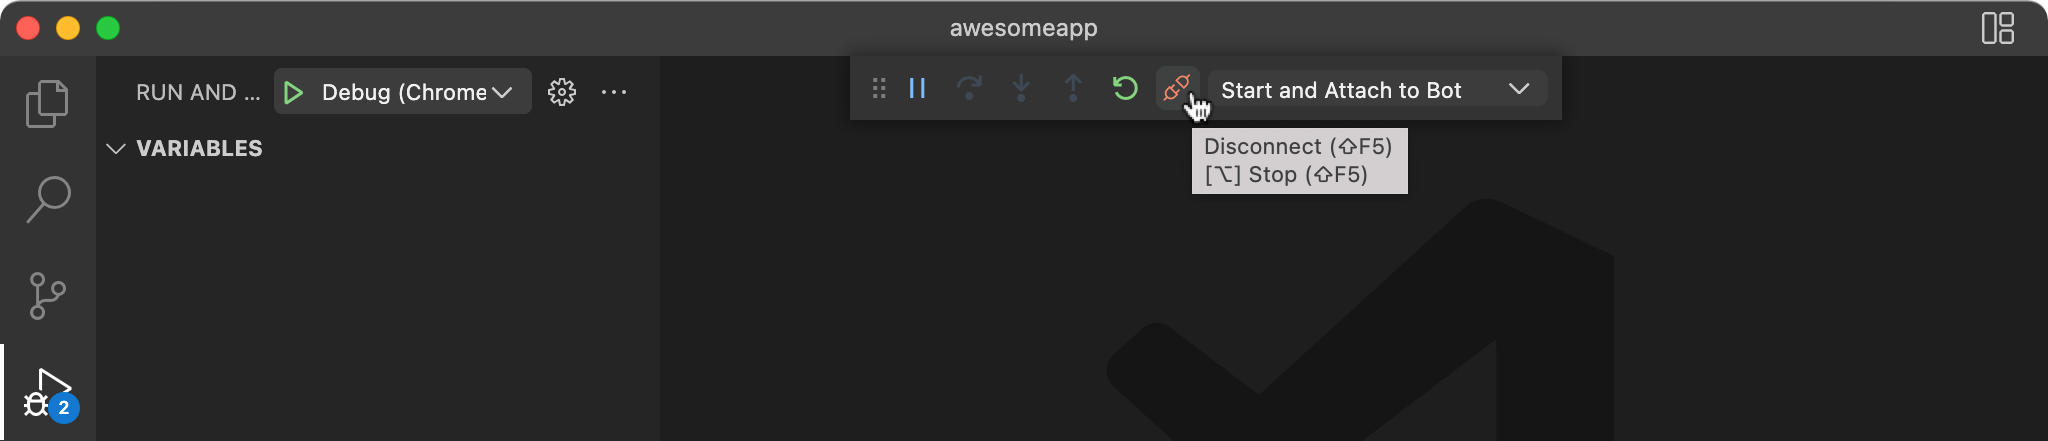
To end the debugging, disconnect in the floating toolbar. Once the session is terminated, it is safe to run again.
🐞 What’s New with Local Debug Experience in Toolkit v3.4?
There are a few new features that have been added in the latest Toolkit to improve your local debugging experience.
✅ Prerequisite Checker
In case you wonder, when you press the F5 key, the Teams Toolkit does:
- Register your app with Azure Active Directory
- Start app services for both backend and frontend
- Start Microsoft Teams in a web browser with a command to instruct Teams to sideload the app from
localhost - Create an app manifest and register the app in Teams Developer Portal
These processes require specific versions of Node.js, packages, various tools, also M365 credentials.
Now in Toolkit v3.4, it checks all the requirements and lists up and displays in Output channel:
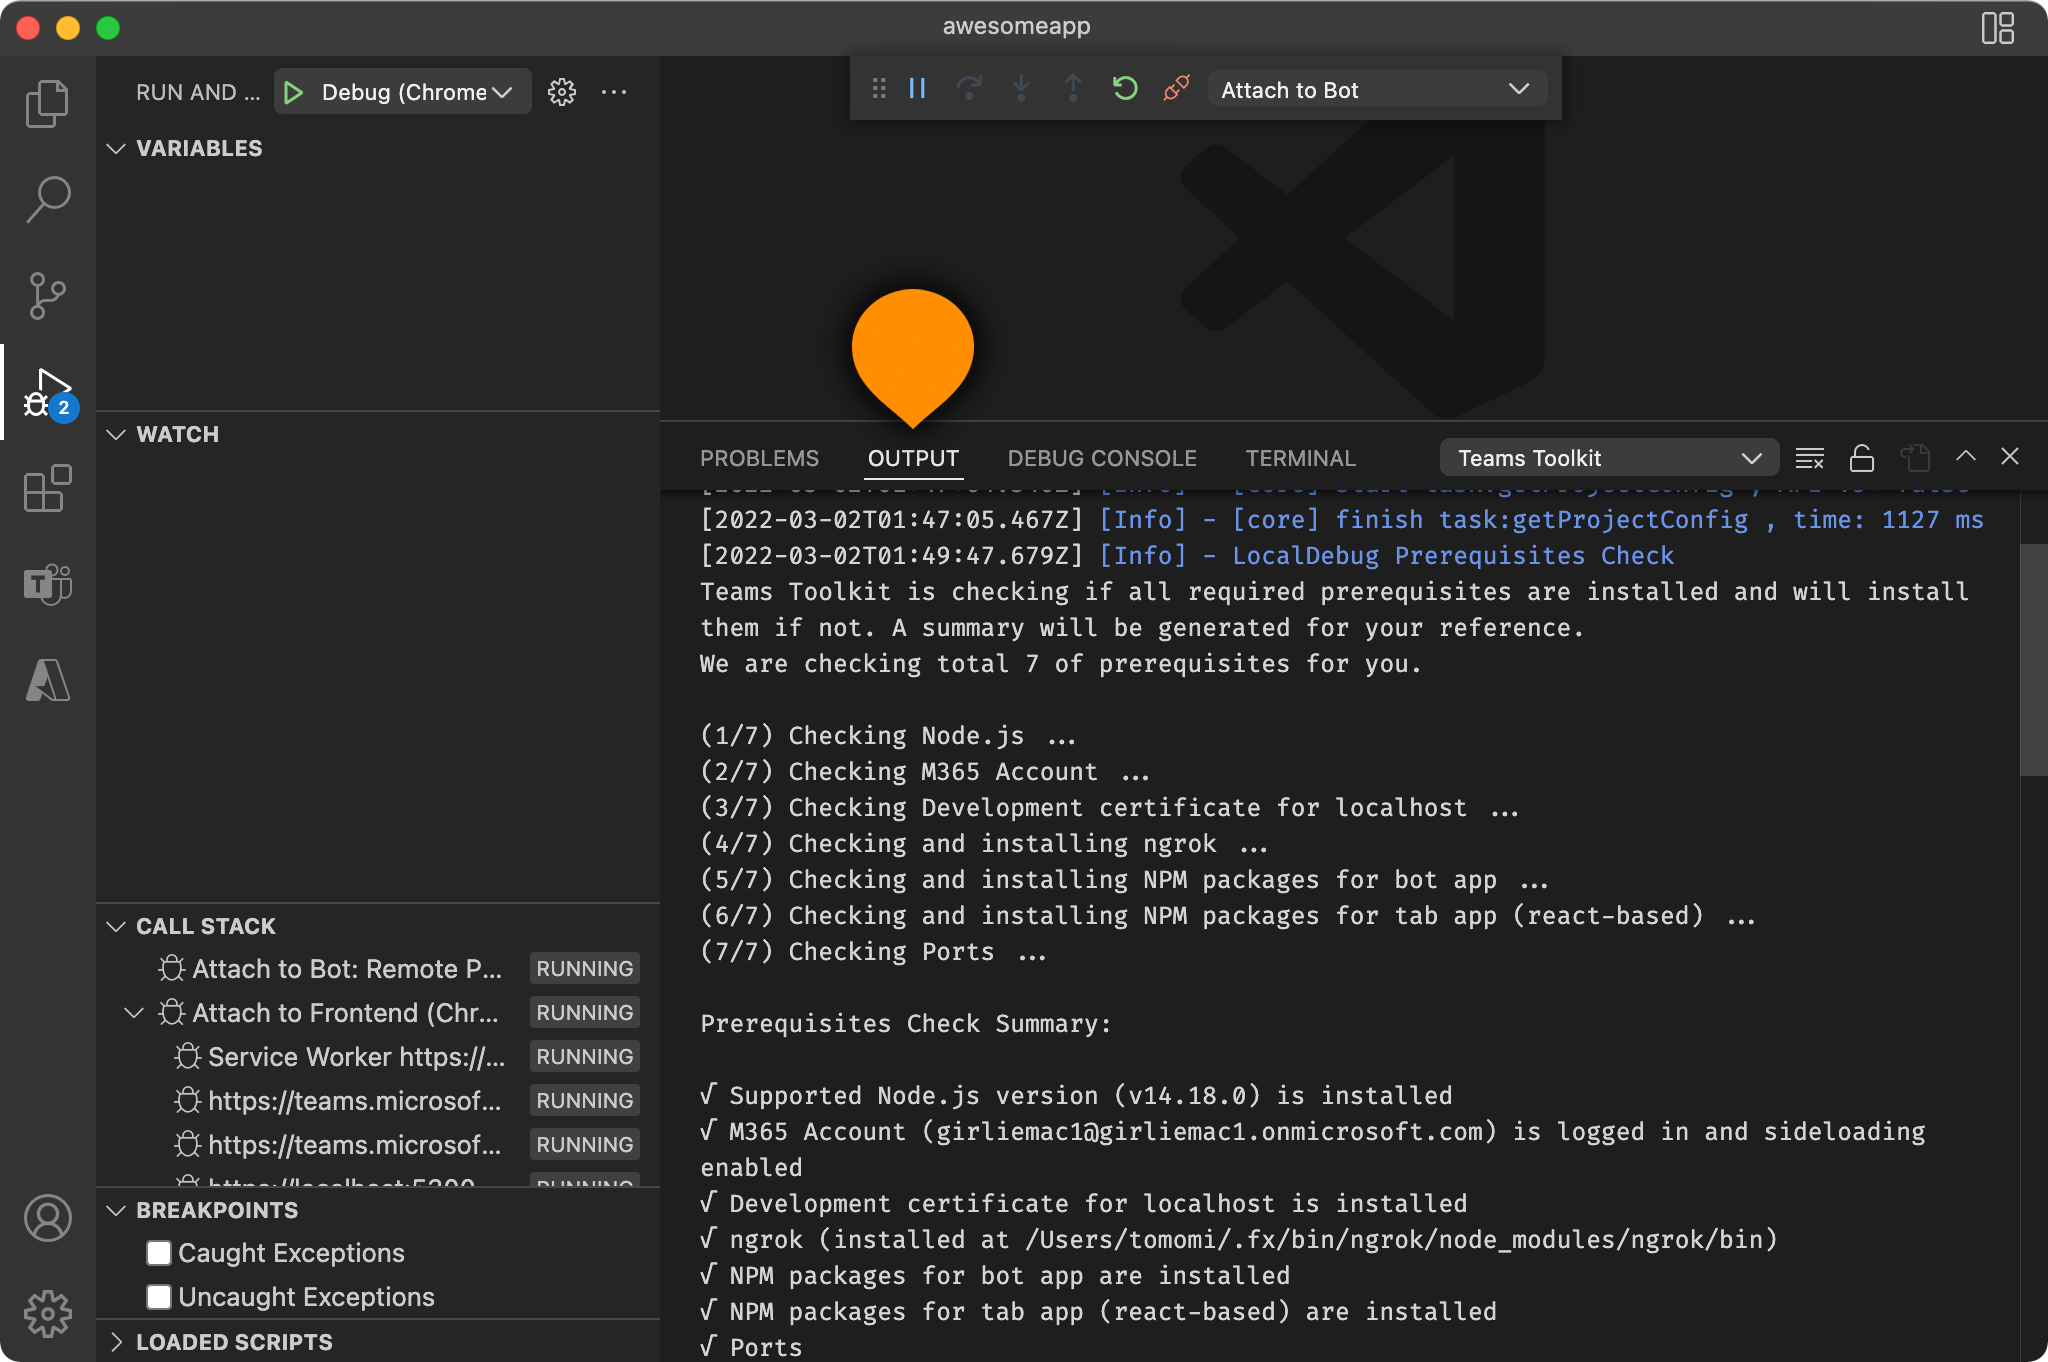
This gives you more transparency and clear ideas about what is going on and easier to figure out when something goes wrong.
⚙️ Customizing Local Debug Settings
Another new feature is that now Toolkit allows you to customize the debug settings. This gives you control over your debugging experience.
Skipping Prerequisites
You can skip some of the prerequisites in VS Code Settings:
- Go to Settings
- Find Extensions in the list and expand it
- Find Teams Toolkit (Preview) and click Prerequisite Check
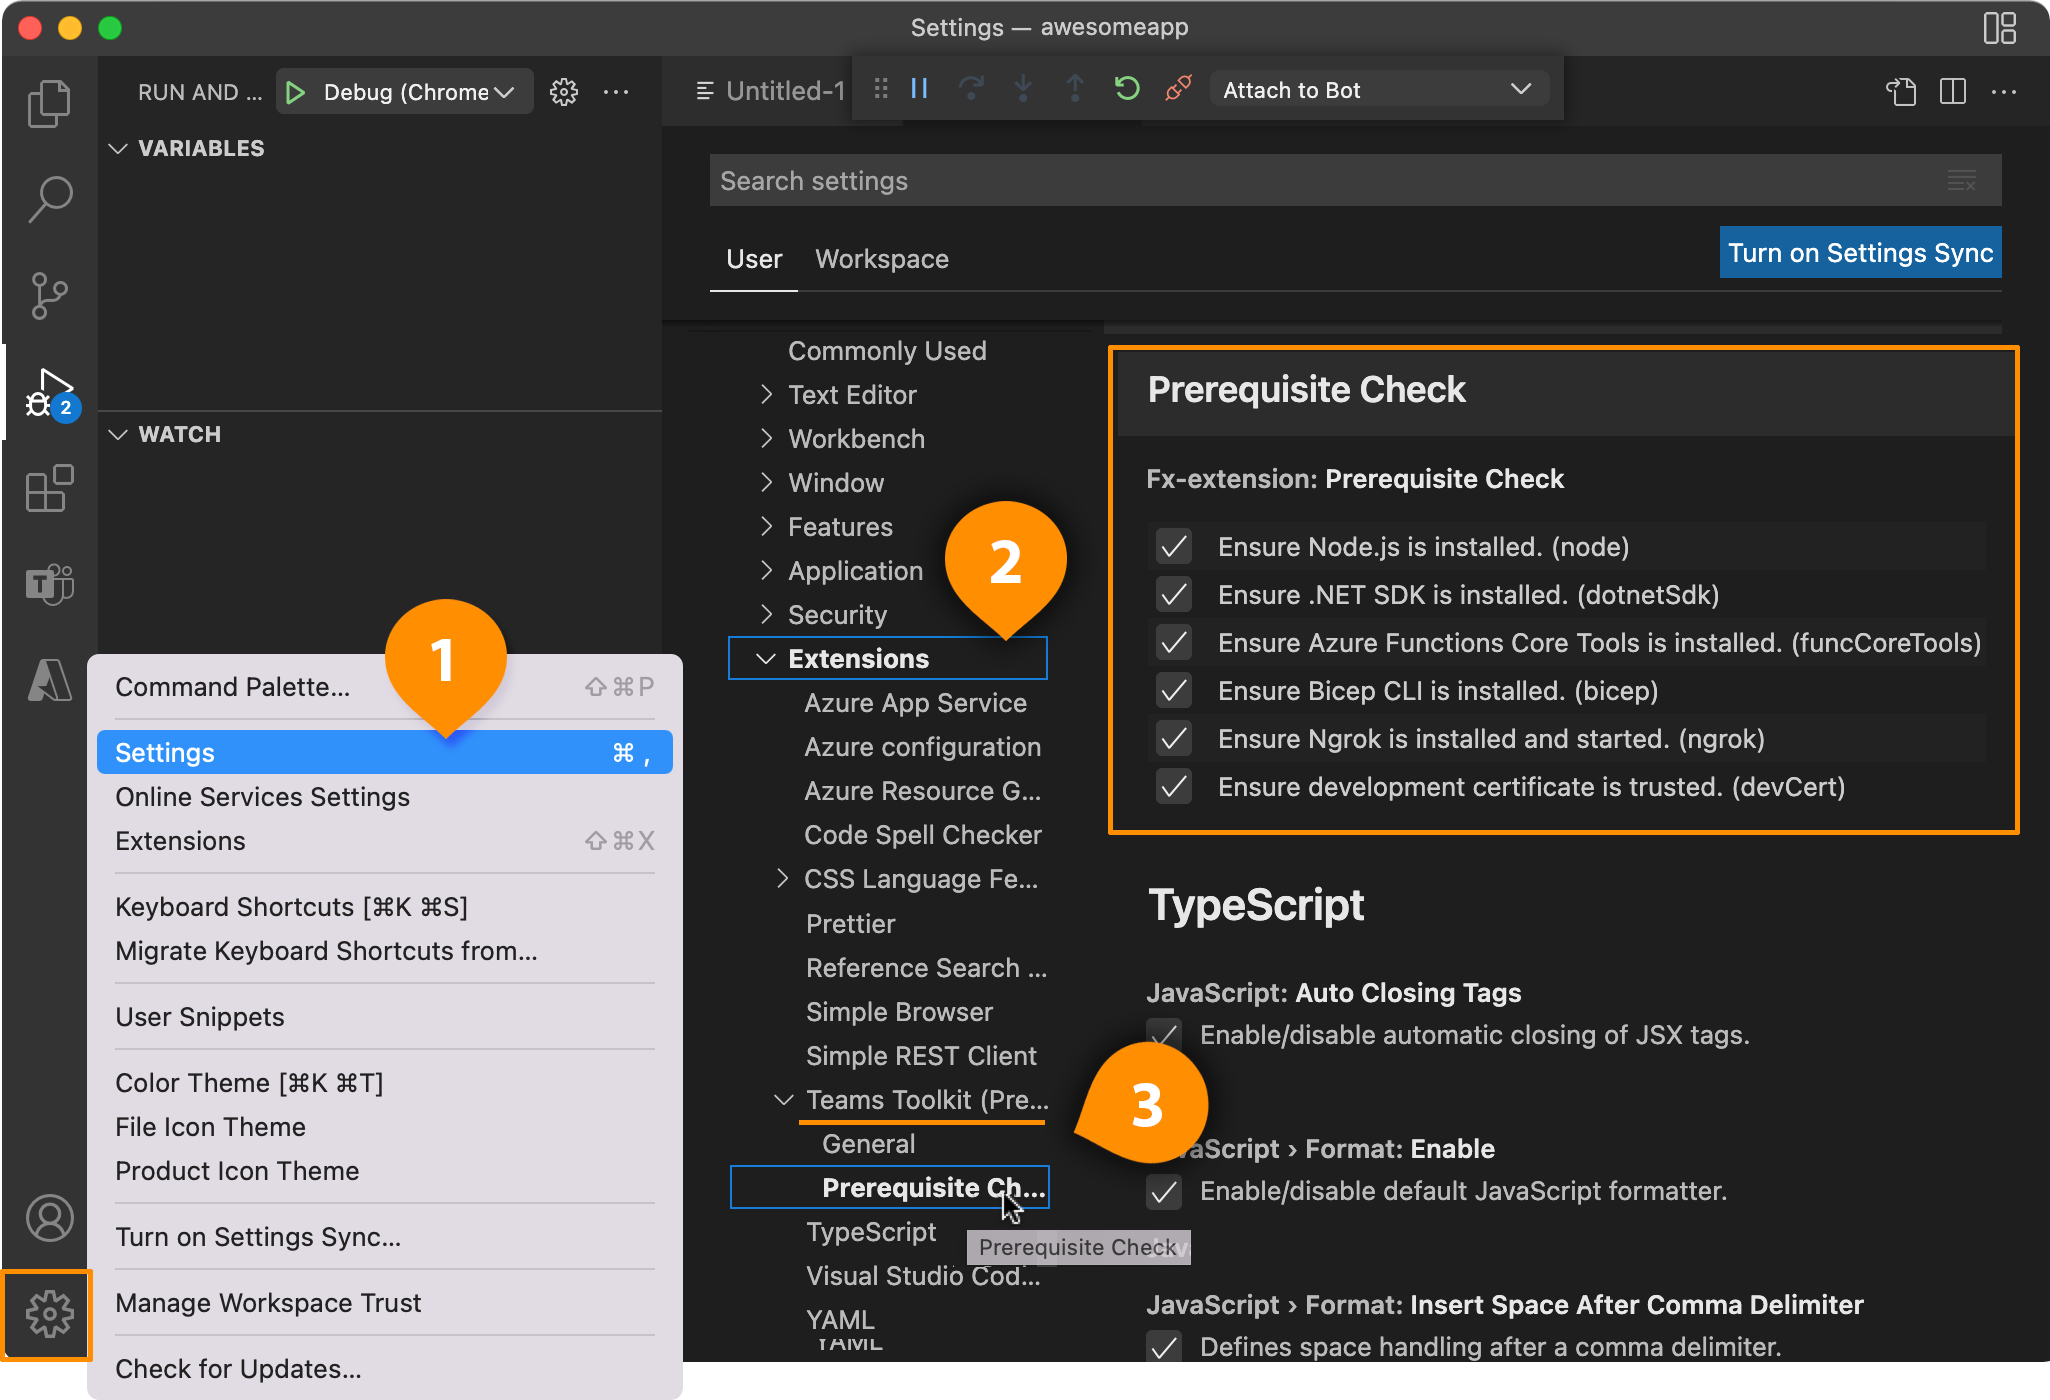
Now you have the checkboxes so you can uncheck the items you would like to skip.
Using Your Own Bot Endpoint
Teams Toolkit uses the 3rd party tool called, ngrok to tunnels your localhost to the internet to run bots. If you wish to use your own bot endpoint,
- At Prerequisites Check in VS Code Settings, uncheck “Ensure Ngrok is installed and started. (ngrok)”
- Set
botDomainandbotEndpointconfiguration in.fx/configs/localSettings.jsonto your own domain and endpoint
Using Your Own Development Certificate
Similarly, you can use your own development certificate,
- At Prerequisites Check in VS Code Settings, uncheck “Ensure development certificate is trusted. (devCert)”.
- Set
sslCertFileandsslKeyFileconfiguration in.fx/configs/localSettings.jsonto your own certificate file path and key file path.
You can learn more about the certificate in TeamsFx documentation on GitHub.
🔧 Manual Customizations
You can also customize your local debug settings manually with editing configuration files.
Using Your Own Start Scripts
For tab:
- Update
dev:teamsfxscript intabs/package.json.
For bot or messaging extension:
- Update
dev:teamsfxscript inbot/package.json.
For Azure functions:
- Update
dev:teamsfxscript inapi/package.json. In addition for TypeScript, updatewatch:teamsfxscript.
⚠️ The ports required by tab app, bot app, messaging extension app and Azure functions are not supported to be customized currently
Adding Environmental Variables
You can add environment variables to .env.teamsfx.local file for tab, bot, messaging extension and Azure functions.
Teams Toolkit will load the environment variables you added to start services during local debug.
⚠️ The environment variables are not supported to hot reload. You need to start a new local debug after adding new environment variables.
Debugging Partial Component
Teams Toolkit utilizes VS Code multi-target debugging to debug tab, bot, messaging extension and Azure functions at the same time.
You can updates .vscode/launch.json and .vscode/tasks.json to debug partial component. Let’s say, you want to debug tab only in an app with tab and bot capabilities with Azure functions project, you can take the following steps:
- Comment out these lines in
.vscode/launch.json:
{
  "name": "Debug (Edge)",
  "configurations": [
    "Attach to Frontend (Edge)",
    // "Attach to Bot",
    // "Attach to Backend"
  ],
  ...
- Comment out these lines in
.vscode/tasks.json:
{
  "label": "Start All",
  "dependsOn": [
    "Start Frontend",
    // "Start Backend",
    // "Start Bot"
  ]
},
I hope you found the article helpful for debugging your Teams apps and the new features give you more confidence debugging your Teams app development!
Please don’t hesitate to drop your comments and feedback here.
See you until the next post 👋
Hello Tomomi, thank you for the information. I would like to know if you add v3 support for .Net/Blazor soon? How about Visual Studio support? Thanks! -David
Pinging this…
The new preview version should be coming soon! Stay tuned for more Teams app development and Toolkit related announcements at Build conference in May.
Hello Tomomi
I am attempting to extend and debug this app https://github.com/OfficeDev/Microsoft-Teams-Samples/tree/main/samples/tab-personal-sso-quickstart/csharp_dotnetcore
I'm on a Mac, I have VS Code and several browsers as well as Teams Desktop - the app runs fine in all.
I can't get a debug session to connect (or at least, I can't get the application to stop at the breakpoints I have set in Code) - should I be able to do that on a Mac? are there any more detailed instructions.
Also, after a code change and restart, how to I get Teams to reload the new code? It seems to cache previous versions of the auth.js...
Hi Matt,
everything stated here works on Mac! In fact, all my screenshots used in the blog post are from VS Code app on my MacBook Pro (Yes, Microsoft employees do use Mac 😉)
Also, hot reload is enabled by default so you don’t need to restart, unless something seems to fail to reload. And thank you for letting me know that the cache issue! I wasn’t aware of.
Hi – to start with I don’t have ‘Debug (Chrome)’ or same for Edge available as a run config in VS Code. Is there something I need to do to set that up?
(They’re not listed under ‘Add Configuration’ either).
Thanks.
Update – the Teams sample code I was using comes from https://github.com/OfficeDev/Microsoft-Teams-Samples
They run fine but I had no success getting them to debug. Any search for ‘Teams samples’ is going to find those first!
The repo Tomomi is using, and is linked from the ‘Samples’ button of the Teams Toolkit is at https://github.com/OfficeDev/TeamsFx-Samples and works as the article above describes.
As for why there are 2 sets of official samples, not cross referenced … go figure.
Hope that helps someone.