

You have just developed your Spring Boot native image application. You want to deploy it on Azure. How can you determine if your application is running well, detect errors in HTTP requests, or identify slow SQL queries? We are going to show you how to monitor a Spring Boot native image application on Azure.
Monitoring set-up
Add the Azure starter monitoring
Let’s take the classic Petclinic application for our example.
Clone the Petclinic project:
git clone https://github.com/spring-projects/spring-petclinicWe will use the Azure Monitor OpenTelemetry Distro / Application Insights in Spring Boot native image Java application project which is a Microsoft distribution of the OpenTelemetry Spring Boot starter.
First, add the Azure starter dependency:
<dependency>
    <groupId>com.azure.spring</groupId>
    <artifactId>spring-cloud-azure-starter-monitor</artifactId>
    <version>1.0.0-beta.4</version>
</dependency>
Then, add the OpenTelemetry BOM:
<dependencyManagement>
    <dependencies>
      <dependency>
         <groupId>io.opentelemetry</groupId>
         <artifactId>opentelemetry-bom</artifactId>
         <version>1.35.0</version>
         <type>pom</type>
      </dependency>
    </dependencies>
</dependencyManagement>
Now, please follow these instructions related to Azure SDK libraries used with a Spring Boot native application.
To identify more easily a little later your Spring Boot native image application in the Azure Monitor application map, you can set the spring.application.name property in the application.properties file:
spring.application.name=PetclinicEnable the SQL requests monitoring
Just add the two following lines to your application.properties file:
spring.datasource.url=jdbc:otel:h2:mem:db
spring.datasource.driver-class-name=io.opentelemetry.instrumentation.jdbc.OpenTelemetryDriver
Build and play with your native image application
You can now build your Spring Boot native application:
mvn -Pnative spring-boot:build-image -Dspring-boot.build-image.imageName=spring-petclinic-nativeYou have to retrieve the connection string of your Application Insights resource receiving the telemetry data. Go to the Azure portal, search for your Application Insights resource or create a new one. On the overview page of your resource, you will find the connection string in the top right corner.
Start your Spring boot native image application with your connection string:
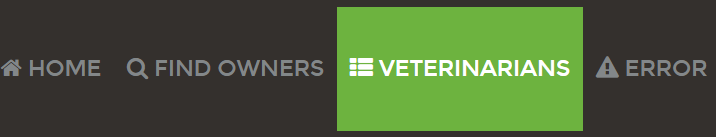
docker run -e APPLICATIONINSIGHTS_CONNECTION_STRING="{connection-string}" -p 8080:8080 spring-petclinic-nativeYou can now visit http://localhost:8080 in your browser and play with your native image application! Don’t forget to click on the Veterinarians and Error menu entries on the top:
Look at the monitoring data in Application Insights
Now, we are going to look at the monitoring data in the Application Insights resource.
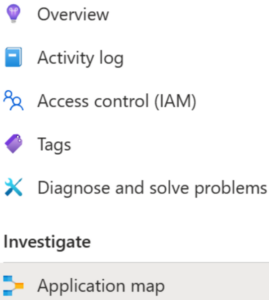
On the left menu, click on Application map:
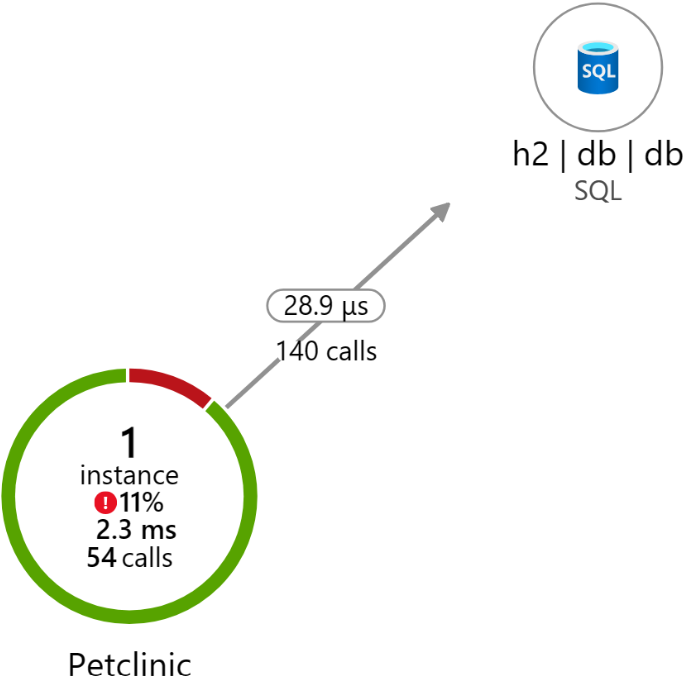
You can see that our Petclinic application is calling an H2 database:
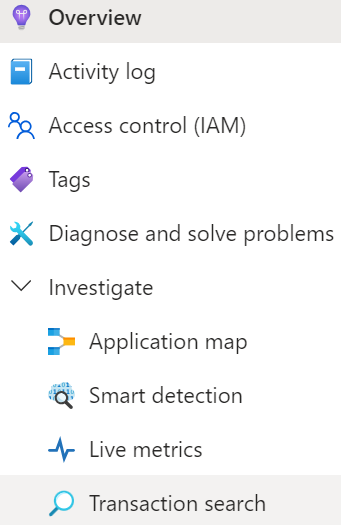
Select now Transaction search:
You can see the logs. Your Spring Boot native image application has started up fast:
![]()
You can also see the HTTP requests and exceptions:
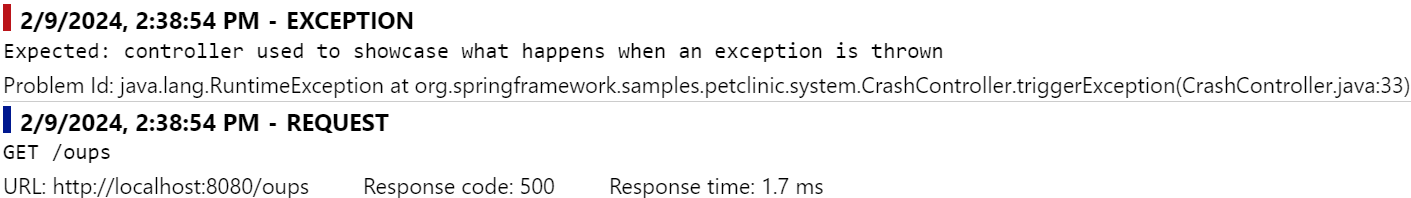
The SQL request are represented as dependencies:
![]()
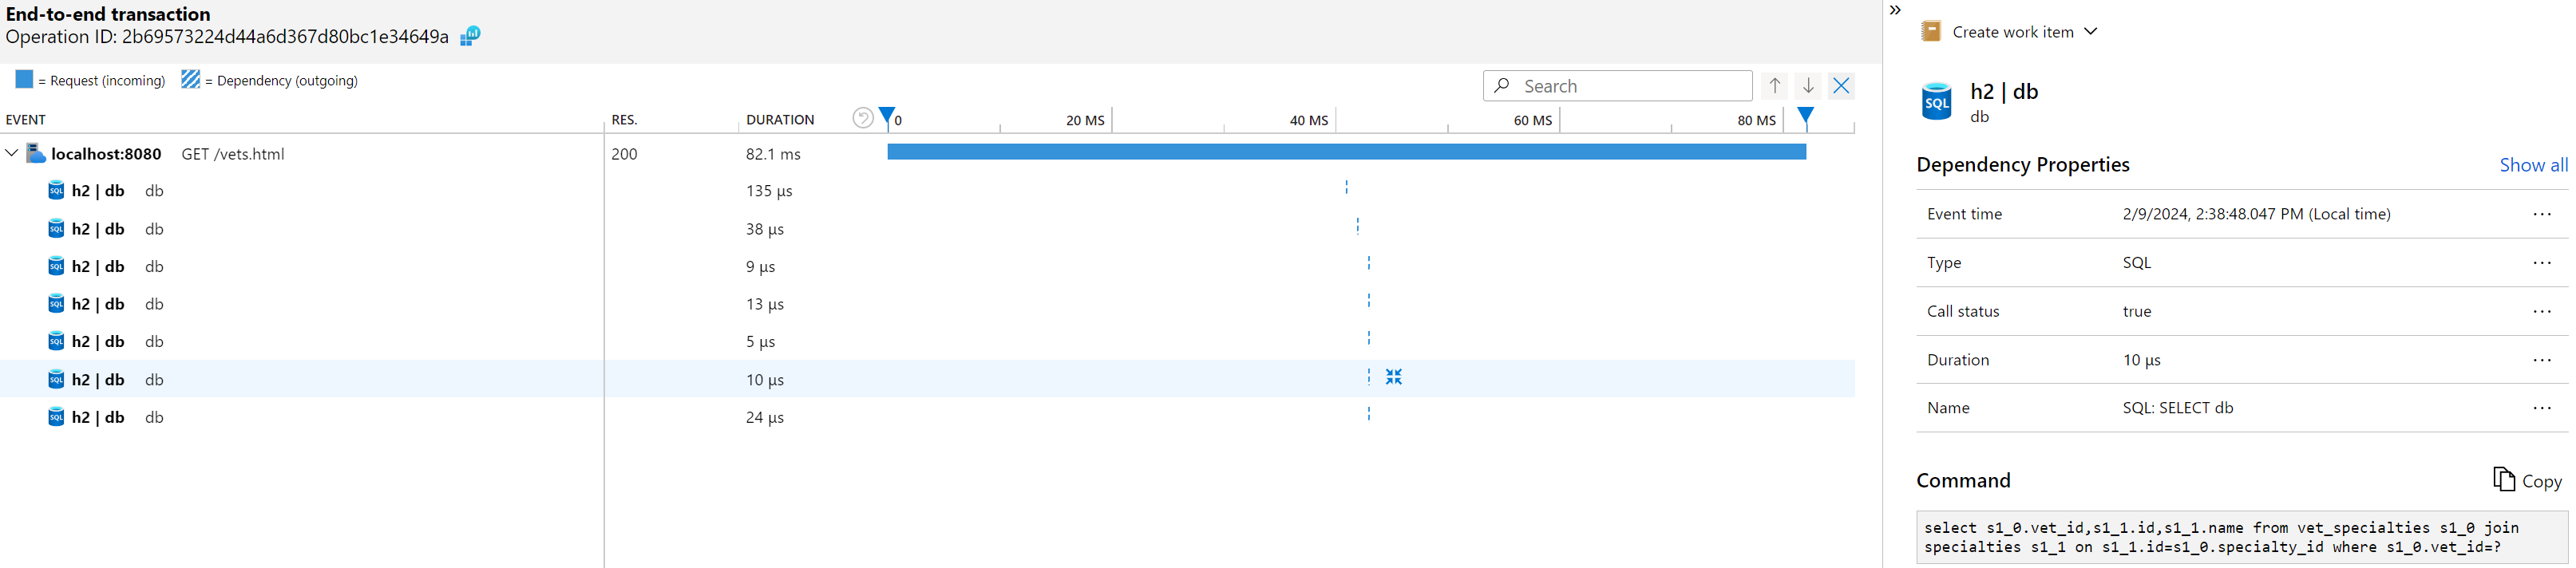
Double click on the /vets request:
![]()
You can now see all the SQL requests executed from the /vets URL:
What’s next?
We are going to add Live Metrics to the OpenTelemetry Distro / Application Insights in Spring Boot native image Java application project. Microsoft will continue to contribute to OpenTelemetry to make the OpenTelemetry starter GA. We look forward to hearing more of your feedback! Please drop us a mail at JavaO11y@microsoft.com
0 comments