
Introduction
Quarkus is a general-purpose Java framework focused on efficient use of resources, fast startup, and rapid development. It allows developers to create and run services in the Java Virtual Machine (JVM) or native binary executables (native mode).
In this blog post we are going to focus on using Quarkus to create and monitor a native mode Quarkus application on Azure.
A simple service will be created from scratch to demonstrate the capability of sending OpenTelemetry data to Azure.
Why native?
Quarkus Native Mode refers to building and running a Quarkus application as a native binary executable, using GraalVM to compile the application Ahead Of Time (AOT) into a platform-specific binary. That is, there is no JVM required at runtime.
Recommended scenarios for native mode:
- Fast start-up required (function)
- No JDK/JRE available on the host machine
- Reduced attack surface (No reflection, less classes loaded, See: https://www.graalvm.org/why-graalvm )
- Applications running for a short amount of time (function)
- High density deployments with many instances running in parallel
- Application with a low CPU or memory limits
- Applications running with constrained resources like:
-
- Edge services
- IoT services
-
Disadvantages:
- Longer build times
- Increased memory at build time
- Reduced GC options. GraalVM CE only supports the serial and epsilon garbage collectors (GC). The Serial GC is single threaded, and the Epsilon GC is a no-op garbage collector used to disable garbage collection if your application is allocation free.
- Compared with a warmed-up application running on the JVM, the throughput is usually less
Create a demo application
Generate the application
We’ll be building a service from scratch, but Quarkus has a quick start process to help us!
Let’s go to https://code.quarkus.io/, a website where Quarkus projects can be easily generated. For this case, you only need to select the following extensions:
-
- quarkus-rest-jackson – REST server with Jackson serialization capabilities.
- quarkus-hibernate-orm – data persistence
- quarkus-agroal – DB connection pool
- quarkus-jdbc-h2 – H2 in-memory DB connection
- quarkus-opentelemetry-exporter-azure – OpenTelemetry extension including the telemetry data exporter for Azure

Click on “Generate your application” and download the zip file.
Once saved and extracted on your local machine, please open the project on your IDE of choice.
The application will provide a REST endpoint and will access an in-memory database. OpenTelemetry tracing already instruments the REST Server and the Database connection manager.
Other Quarkus extensions (Kafka, REST, …) can provide additional instrumentation and OpenTelemetry data.
Modify the GreetingResource class
We’ll modify the bundled GreetingResource class to add an entry to the in-memory database.
@Path("/hello")
public class GreetingResource {

    @Inject
    EntityManager manager;

    @POST
    @Produces(MediaType.TEXT_PLAIN)
    @Transactional
    public String hello() {
        MyEntity o = new MyEntity();
        o.field = "data to store";
        manager.persist(o);
        return "Hello from Quarkus REST";
    }
}
Configure database properties
Add the following properties to the application.properties file to allow you application to access to the H2 database:
quarkus.datasource.kind=h2
quarkus.datasource.jdbc.url=jdbc:h2:mem:default
quarkus.hibernate-orm.database.generation=drop-and-create
Configure the telemetry features
Enable additional telemetry
We are going to enable OpenTelemetry metrics and logs. In addition, we will enable the JDBC telemetry to provide OpenTelemetry JDBC spans that is to say SQL executions in the OpenTelemetry trace.
Update your application.properties file:
quarkus.otel.logs.enabled=true
quarkus.log.metrics.enabled=true
quarkus.datasource.jdbc.telemetry=true
Also add the OpenTelemetry JDBC dependency to the pom.xml:
<dependency>
   <groupId>io.opentelemetry.instrumentation</groupId>
   <artifactId>opentelemetry-jdbc</artifactId>
</dependency>
Configure the Application Insights connection string
Create an Azure Application Insights resource if you don’t have one.
Go to the Azure portal, search for your Application Insights resource, or create a new one. On the overview page of your resource, you will find a connection string in the top right corner.
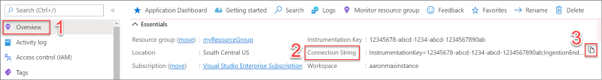
Create an APPLICATIONINSIGHTS_CONNECTION_STRING environment variable with the connection string value.
The connection string must be kept private and must not be committed to public repositories.
Build and run Java native executable
To build the native executable you need to:
- Have Graalvm CE 23.0.x.x+ from Oracle Labs installed, or Mandrel 23.1.x.x from Red Hat.
- Have Maven 3.9.8+ or Gradle 8.10+ installed.
- All this can be installed with Sdkman.
- Set the GRAALVM_HOME environment variable to the location of your GraalVM installation. Example for Mac and Linux:
export GRAALVM_HOME=/Users/me/.sdkman/candidates/java/23.0.2-graalceTo build the executable, you just need to execute:
./mvn clean package -DnativeYou can then execute your native executable locally with:
./target/<your app name>-1.0.0-SNAPSHOT-runnerYou can use this command to call the application endpoint:
curl -X POST http://localhost:8080/helloVisualize the telemetry data on Azure
We can now come back to our Application Insights resource.
On the left menu, we click on Application map.
We can then see that our application is calling an H2 database.

Now we click on Transaction search on the left menu.
The Application Insights UI displays the OpenTelemetry data the following way:
| OpenTelemetry | Application Insights |
| Server spans | Requests |
| Log | Traces |
| Other Span Types (Client, Internal, etc.) | Dependencies |
On the Transaction search we can spot that our Quarkus native application has started up very quickly from the following application log:
![]()
We can also see the POST call together with SQL activities (get connection, select, insert):
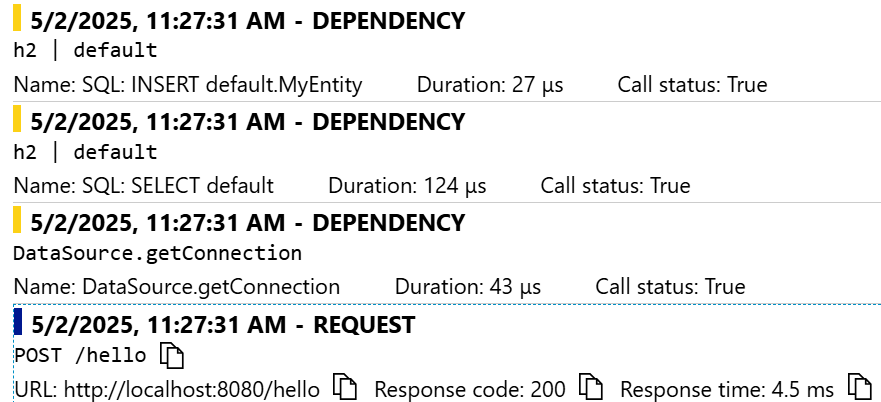
Now, we double click on the POST request.
We can see that SELECT and INSERT statements executed from the POST call:


Deploy a Java native image on Azure
Build a container image
You can create a container image with a Quarkus native executable by following this Docker file example.
Deploy the container image on Azure
You can now deploy the image to the Azure service of your choice: Azure App Service, Azure Kubernetes Service, Azure Container Apps or Azure Functions. You will need to set the APPLICATIONINSIGHTS_CONNECTION_STRING or the QUARKUS_OTEL_AZURE_APPLICATIONINSIGHTS_CONNECTION_STRING environment variable with the connections string value retrieved from the Azure environment. The quarkus-opentelemetry-exporter-azure extension will work on all Azure services.
You can find an example on how to deploy a Quarkus native image application on Azure Container Apps in this Github repository.
Conclusion
In this blog post we explain how to enable and send OpenTelemetry telemetry to Azure with a Quarkus native application. You can find the code for the blog post demo here. We look forward to hearing more of your feedback! Please drop us a mail at JavaO11y@microsoft.com or create a GitHub issue.
0 comments