
Last Friday I was reviewing our backlog items in the Java Engineering Group, and found an idea we had when Log4Shell happened. To this day, there is still no main stream solution to “find in production where a given JAR is being used“.
Why runtime truth matters (Log4Shell)
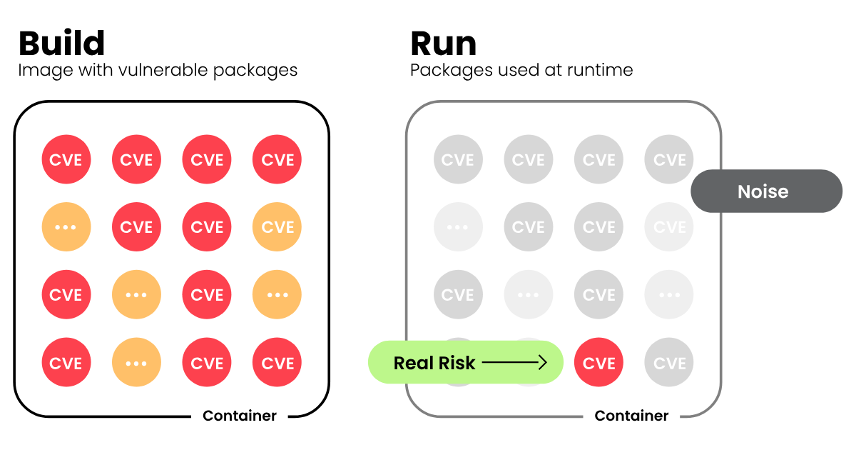
When Log4Shell hit, lots of teams hunted for log4j through source control and CI pipelines. Helpful, but incomplete. Two realities get in the way:
-
Not every production system maps cleanly back to your repos. ISV/third‑party applications sometimes only ship their binaries, and customers just run them in their production environments, without access to Git or build pipelines.
-
Not every JAR on the classpath is actually used. Something that looks critical on paper can be of low (or no) risk at runtime.
- And the reverse can be true, and worse.
Finding where a vulnerable artifact is present in production, at runtime, and whether is being used, is far more important than monitoring source code and build pipelines. We should focus on that.
So, the idea was simple: build a solution that inspects JVMs in production, and identifies all JARs loaded, and map which JARs are actually being used and which ones are not.
Runtime context over CVSS noise
Funny enough, just last month, Crystal Morin captured this well in her article on The New Stack:
“Far too many vulnerabilities categorized as ‘critical’ and ‘high’ don’t warrant the attention we assume they do… they just simply lacked operational context. […] This starts with rejecting the idea that all CVEs deserve equal treatment. We need better filters. […] One of the most impactful ways to do so is by focusing on runtime context: those vulnerabilities that are actually running in production.”
Source: Turn Down the CVSS Noise: Use AI and Runtime Context to Silence Vulnerability Alarms (The New Stack, Aug 20, 2025).
10 hours in, JLib Inspector was born
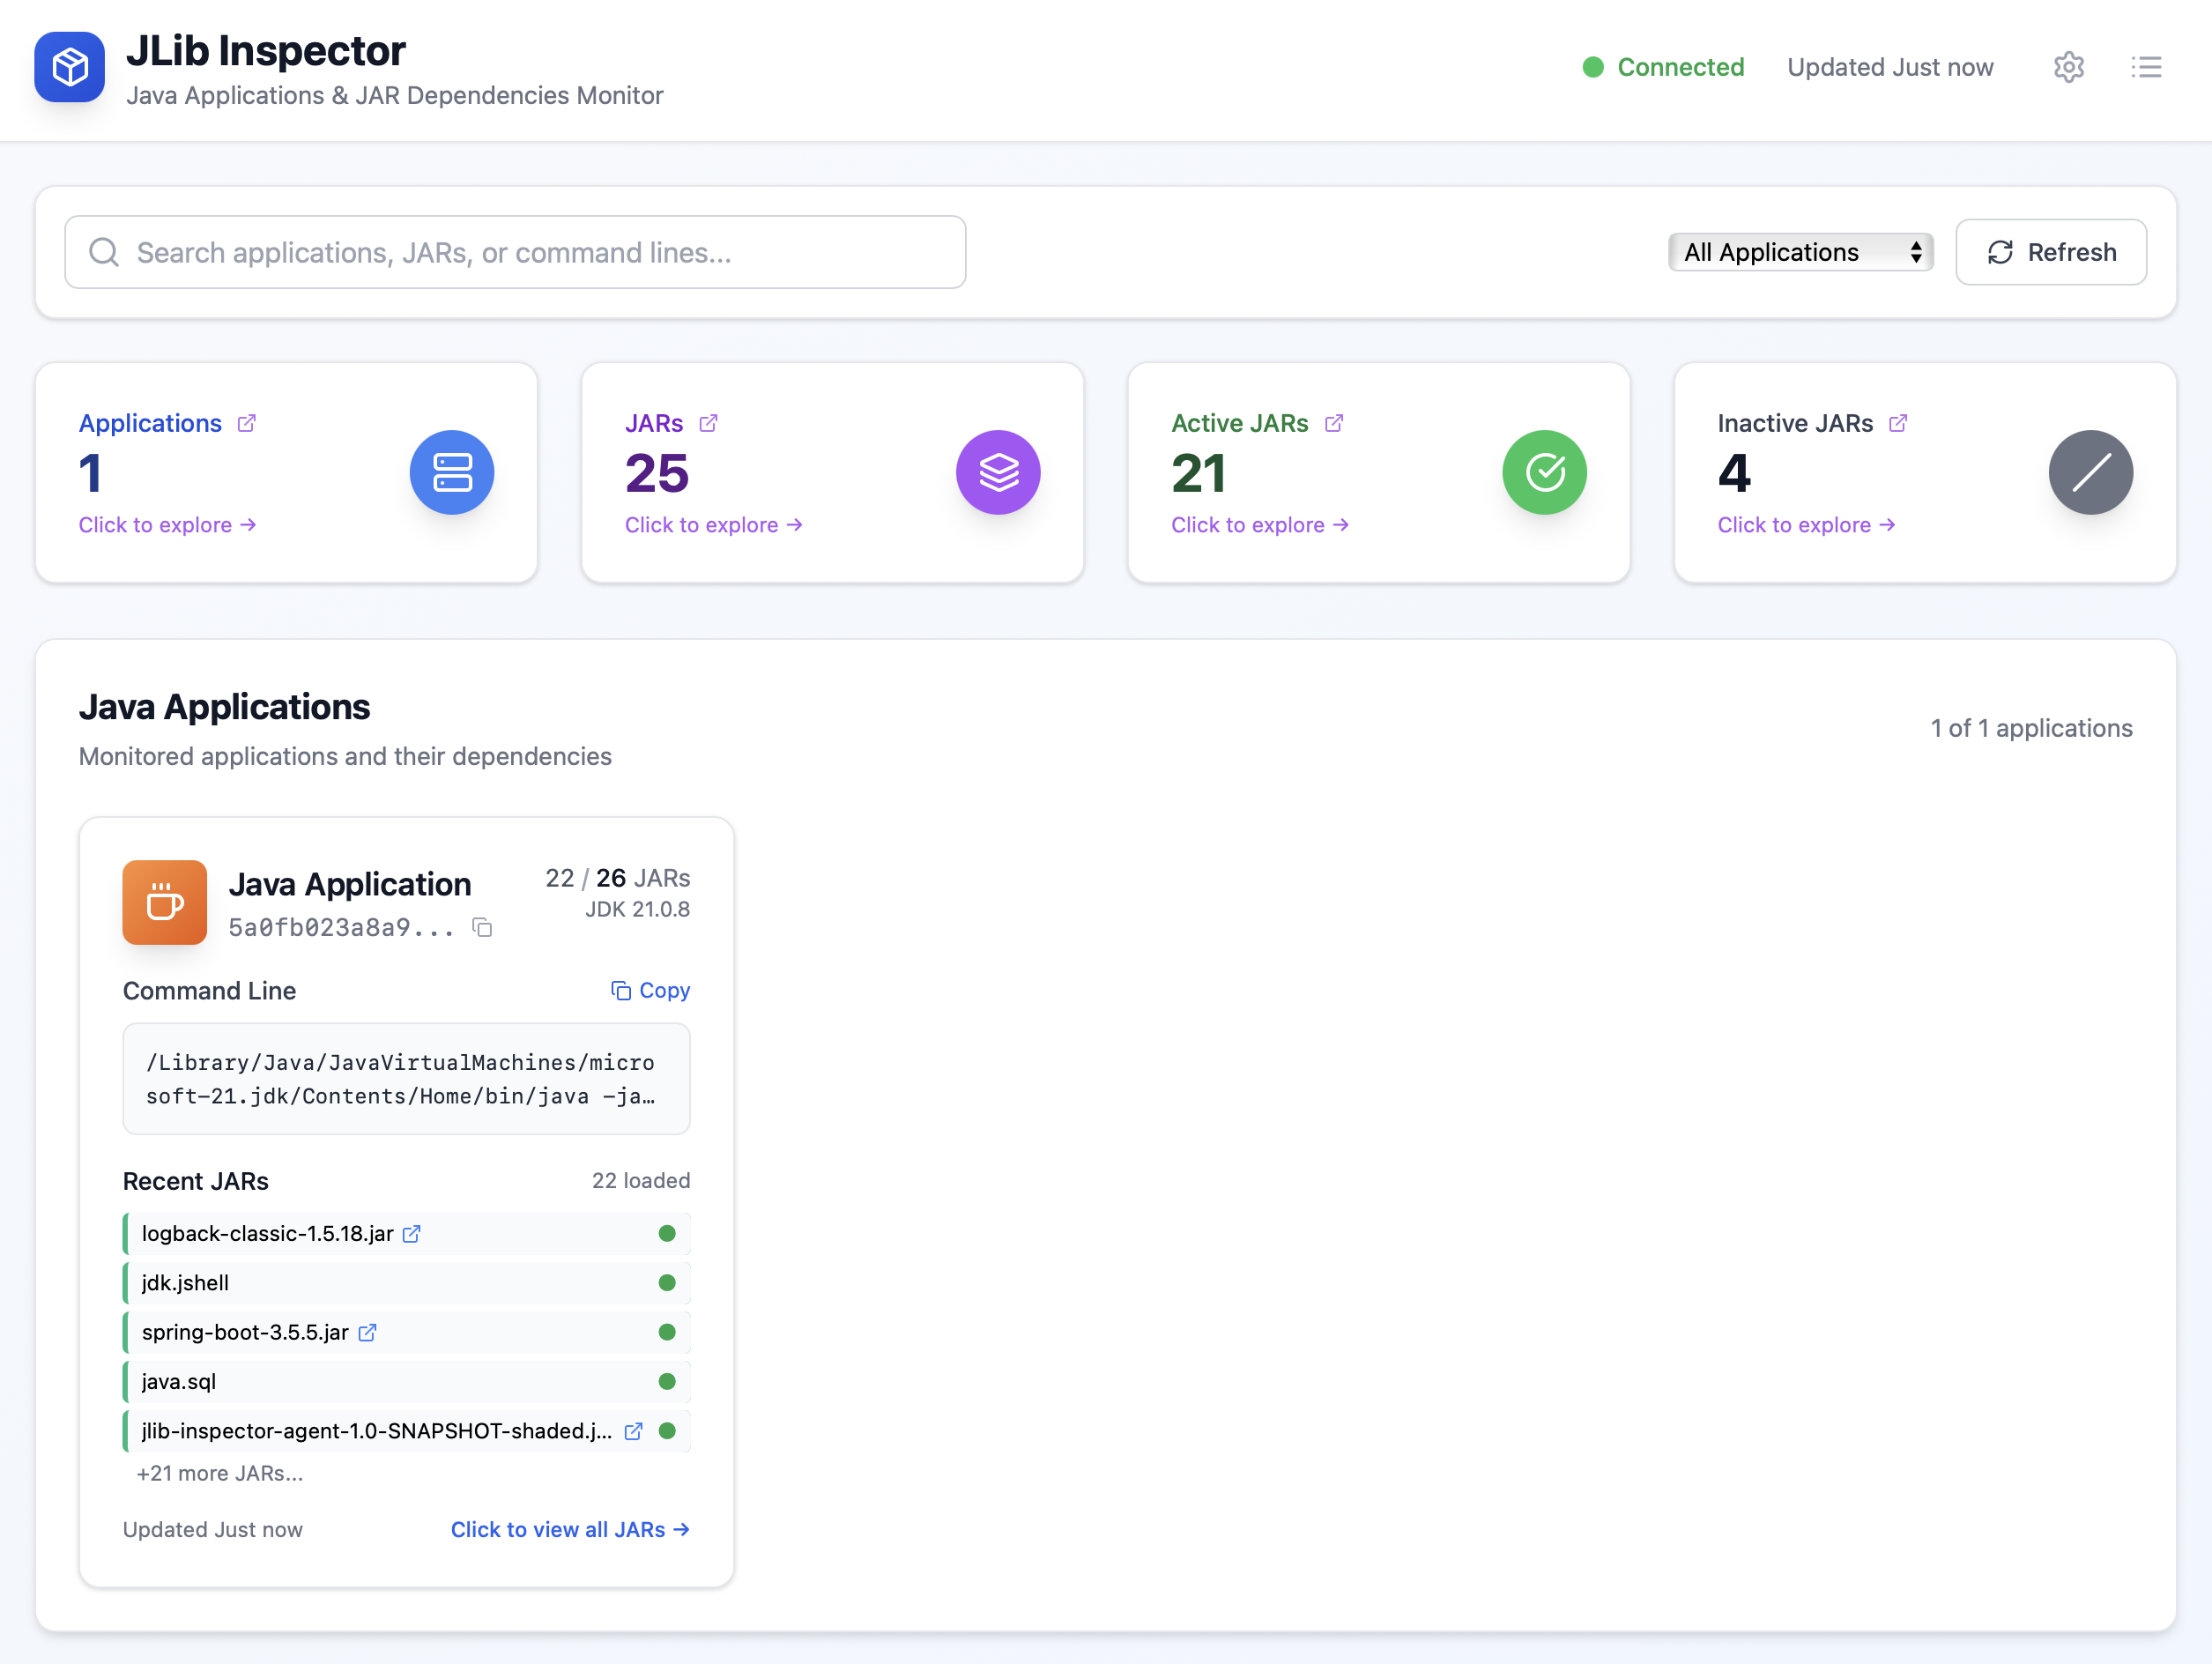
JLib Inspector is a small tool with a simple goal: show what JARs your Java applications are actually running with, across all services, in one place. It collects runtime inventory via a Java agent, stores it in a lightweight backend, and presents it in a clean dashboard. JLib Inspector answers with runtime truth. The agent reports what the JVM actually loads, app by app. The dashboard aggregates unique JARs across applications and highlights Active (loaded) vs Inactive, with links back to each app. That makes triage practical: prioritize what’s truly in memory, then circle back to clean up the rest.
I kicked this off on a Friday morning. Between emails, kids, and everything else, most of the code was produced by AI while I steered the direction, filled the gaps, and made the judgment calls. Using Visual Studio Code, GitHub Copilot, and GPT-5, the first usable version came together in roughly ten hours of fragmented time.
The architecture is intentionally boring. A Java agent attaches to any JVM and reports the list of JARs (with metadata). A tiny Java HTTP server receives that data and serves it via a few endpoints. A React dashboard (served by an Express proxy) consumes those endpoints and keeps the UI fresh over WebSocket pushes. That’s it.
[Java App(s)] --(agent)--> [Server] <--(HTTP/WS)--> [Dashboard]
    |                          ^
    |                          |
    +---- JAR inventory -------+
On the UI side, the dashboard starts with a snapshot of total applications and JARs. You can drill into “JAR Dependencies,” filter by Active/Inactive, and jump into application pages. Application pages let you give friendly names, descriptions, and tags; edits save through an endpoint and update the views immediately. We ditched modals for simple hash-based pages (#/app/{id}, #/jars/{filter}) with a Back button and Escape to return.
Under the hood, I kept the tooling tight: Java 21 with Maven 4, a tiny HTTP server using the built-in API in Java SE, JaCoCo for coverage, JUnit for tests; React with a small build, an Express proxy, and a WebSocket server. Copilot and GPT-5 sped up the plumbing (components, handlers, routing, and state wiring) so attention stayed on behavior and UX rather than boilerplate.
Get started with JLib Inspector
Prerequisite: Docker Desktop
- Start the server and dashboard with Docker Compose
cd docker
docker compose up -d
Then open:
- Frontend: http://localhost:3000
- Backend health: http://localhost:8080/health
- Run the Java agent with the sample Spring Boot app
If you haven’t built the artifacts locally yet, do a quick build once from the repo root:
./mvnw -q clean verify
Now attach the agent and run the sample app:
java -javaagent:agent/target/jlib-inspector-agent-1.0-SNAPSHOT-shaded.jar=server:8080 \
  -jar sample-spring-app/target/sample-spring-app-1.0-SNAPSHOT.jar
- Watch the dashboard update
Open http://localhost:3000 and you should see applications appear as the agent reports in.
Notes, tips, and gotchas
Use the Maven wrapper (./mvnw) so the right version is used automatically. You’ll need JDK 21, and Node 18+ for the dashboard. If the frontend can’t reach the backend, check JLIB_SERVER_URL and make sure the server’s /health endpoint is up. If a shaded JAR is missing, rerun the Maven build and verify the target paths outlined above.
What’s next
This was mostly AI-assisted coding with human direction: fast to assemble, small enough to understand, and easy to extend. If you want a feature, open an issue or start a discussion. The natural next steps are enriching inventories with vulnerability data, better search and tagging, and exporting inventories and diffs between environments. The baseline is in place; the rest is iterative UX.
Another idea is to bring this as a feature to Azure App Insights.
What are your thoughts? Comment below!
The code is on GitHub.
Happy to hear your thoughts and feedback!
Update 2025-09-09: well, actually, I learned from friends in Azure App Insights that OpenTelemetry does have a JarAnalyzer event that emits data about JARs loaded during runtime. You can check out the documentation. The property is called otel.instrumentation.runtime-telemetry.package-emitter.enabled. If you are using OTel, go check this out and create a dashboard right now!
0 comments