


In a previous post, we explored how to perform data validations with Great Expectations (GX) in Microsoft Fabric. We walked through how to set up the validation framework and ensure your data meets the quality standards expected. Now, in this follow-up post, we’ll show how to store the GX validation results in Fabric Eventhouse and how to easily query the data for insights. We’ll also demonstrate how Eventhouse can act as an audit store, keeping track of all the validation results and providing real-time monitoring capabilities.
Why Store GX Validation Results in Fabric Eventhouse?
Integrating GX validation results with Fabric Eventhouse brings powerful capabilities for organizations seeking scalable, observable, and well-governed data validation workflows. While other databases may offer basic data storage, Eventhouse is uniquely suited to the nature of validation data due to the following:
- Native Event Model for Observability: Eventhouse is purpose-built for storing and querying event-based data — making it a natural fit for capturing GX validation runs as discrete, timestamped events. This allows for real-time monitoring, anomaly detection, and pattern analysis over time.
- Integrated with the Microsoft Fabric Ecosystem: If you’re already using Microsoft Fabric for data engineering or analytics, storing GX validation results in Eventhouse allows seamless integration with your existing pipelines, dashboards (Power BI), and governance tools — reducing friction and increasing visibility across teams.
- Efficient Querying at Scale: Validation data tends to grow quickly, especially in CI/CD or automated testing contexts. Eventhouse’s optimized architecture for high-throughput ingest and fast analytical queries ensures that you can access both recent and historical validation results efficiently, even at scale.
- Centralized and Immutable Audit Trail: Unlike traditional relational databases that may require custom schema design for auditing, Eventhouse offers out-of-the-box support for event history and change tracking, making it easier to maintain a robust and transparent audit trail for compliance and debugging.
Setting Up Fabric Eventhouse
Before we can store the validation results from Great Expectations, we need to set up Fabric Eventhouse. Here’s how you can do it:
- Create an Eventhouse in Microsoft Fabric:
- Navigate to the Microsoft Fabric portal.
- In the Fabric UI, go to Eventhouse and click on Create New Eventhouse.
- Choose the appropriate name.
- Click Create to provision your Eventhouse.
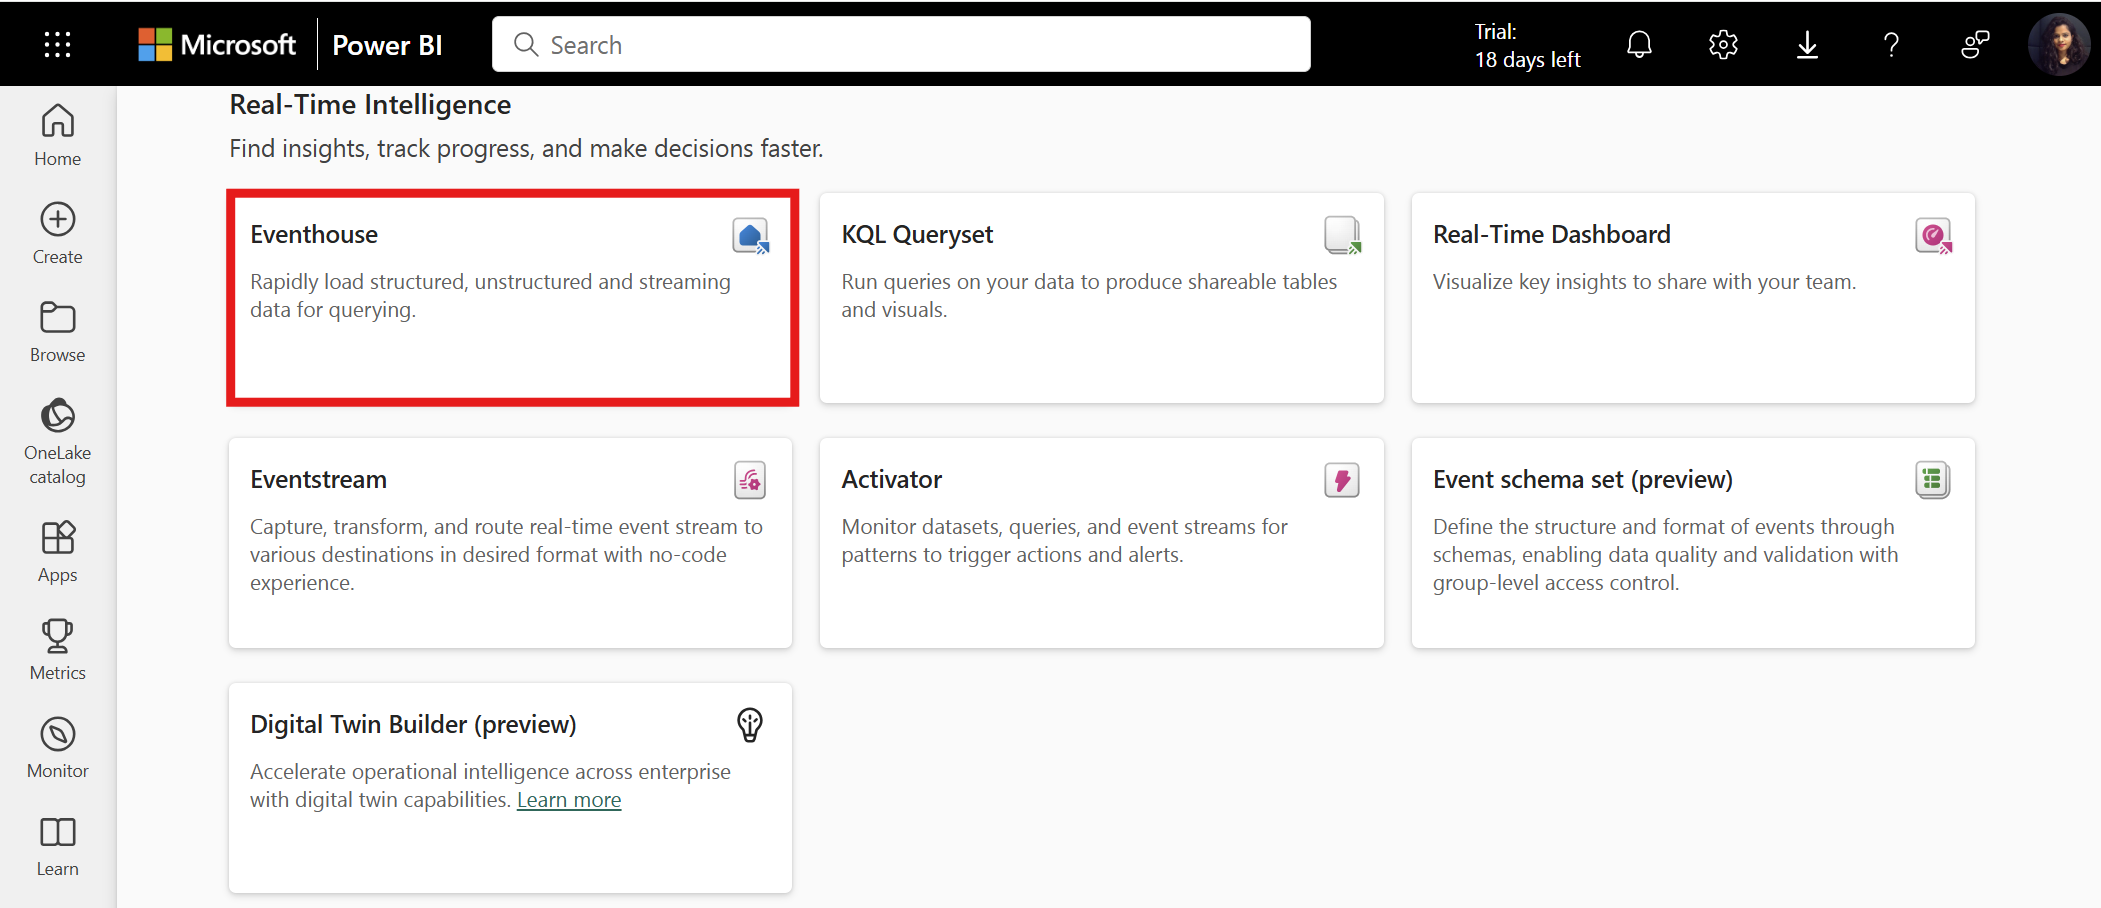
This process will automatically create a KQL database with the same name inside Eventhouse, which we are going to use to store our data validation results.
Storing GX Validation Results in Eventhouse
Now that we have Eventhouse ready, let’s look at how to store your GX validation results in Eventhouse after running your data validation.
In the previous post, we executed data validations using Great Expectations (GX) and obtained the validation results. Now, let’s see how to store this validation result in Eventhouse for future analysis and auditing.
💡 Tip : You can continue working in the same notebook you created in the previous blog post. Just add the following steps to enrich it further by storing and analyzing the validation outputs.
We will use the following validation result from previous blog post:
{
  "results": [
    {
      "success": true,
      "expectation_config": {
        "type": "expect_column_values_to_be_unique",
        "kwargs": {
          "batch_id": "test_data_source-test_data",
          "column": "ID"
        }
      },
      "result": {
        "element_count": 5,
        "unexpected_count": 0,
        "unexpected_percent": 0.0
      }
    },
    {
      "success": false,
      "expectation_config": {
        "type": "expect_column_values_to_be_between",
        "kwargs": {
          "batch_id": "test_data_source-test_data",
          "column": "Score",
          "min_value": 80.0
        }
      },
      "result": {
        "element_count": 5,
        "unexpected_count": 1,
        "unexpected_percent": 20.0,
        "partial_unexpected_list": [
          78.9000015258789
        ]
      }
    }
  ]
  // ... additional metadata and summary fields
}
Preparing the Data
We will convert this result into a Spark DataFrame and enrich it with some additional data fields that will help us identify each validation run in the future. Here’s the code for preparing the data:
from pyspark.sql.types import StructType, StructField, StringType
from datetime import datetime
import json
import uuid
# Define the schema for the Spark DataFrame to ensure type consistency
schema = StructType([
StructField("GX Validation ID", StringType(), True), # Unique ID for each validation entry
StructField("GX Validation Rule", StringType(), True), # Rule type and parameters applied
StructField("Validation date", StringType(), True), # Timestamp of validation run
StructField("Data Record ID", StringType(), True), # ID of the validated record/rule
StructField("Detailed Result", StringType(), True), # Full detailed result (JSON string)
StructField("Result", StringType(), True) # Overall success/failure ("True"/"False")
])
# Build the list of dictionaries based on validation_results (assuming validation_results is already defined)
gx_data = []
# Get metadata for the validation
data_source = validation_results["meta"]["active_batch_definition"]["datasource_name"]
validation_date = datetime.now().strftime("%Y-%m-%d %H:%M:%S")
# Loop through the validation results and structure the data
for result in validation_results["results"]:
gx_data.append({
"GX Validation ID": str(uuid.uuid4()), # Use uuid4 to generate unique IDs
"GX Validation Rule": f'{result["expectation_config"]["type"]}, kwargs = {result["expectation_config"]["kwargs"]}',
"Validation Date": validation_date,
"Data Record ID": result["expectation_config"]["id"],
"Detailed Result": json.dumps(result["result"]),
"Result": str(result["success"]), # Store success as a string ("True"/"False")
})
# Create a Spark DataFrame from the list of dictionaries and schema
validation_df = spark.createDataFrame(gx_data, schema=schema)
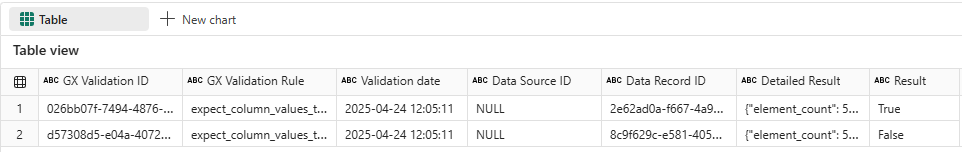
# Display the DataFrame to inspect the data
display(validation_df)This will generate output as follows:
Storing the Data in Eventhouse
Next, we’ll store this data into the KQL database (Eventhouse) for querying and analysis. The following code shows how to write the DataFrame to Eventhouse using batch ingestion:
# Replace your connection details here
kustoUri = "<YOUR_CLUSTER_URI>"
database_name = "<YOUR_DATABASE_NAME>"

accessToken = mssparkutils.credentials.getToken(kustoUri)

# Write to validation result in KQL DB
validation_df.write \
  .format("com.microsoft.kusto.spark.datasource") \
  .option("kustoCluster", kustoUri) \
  .option("kustoDatabase", database_name) \
  .option("kustoTable", "MyEventTable") \
  .option("tableCreationMode", "CreateIfNotExist") \
  .option("accessToken", accessToken )\
  .option("tableCreateOptions", "CreateIfNotExist") \
  .mode("Append") \
  .save()
Note: The above example uses batch ingestion, which is well suited for periodic data uploads (e.g., hourly, daily validations). For real-time or near real-time data ingestion, Eventhouse (Kusto) also supports streaming ingestion. ➡️ Learn more about streaming ingestion here in the official documentation.
Query the Data Using KQL (Fabric Notebook in PySpark)
Now that your data is written to Eventhouse, you can query it using KQL in your Fabric Notebook. Here’s a simple KQL query to fetch 5 records from the table:
kustoQuery = "MyEventTable | take 5"

# Replace your connection details here
kustoUri = "<YOUR_CLUSTER_URI>"
database_name = "<YOUR_DATABASE_NAME>"

accessToken = mssparkutils.credentials.getToken(kustoUri)

# Query Eventhouse using KQL in Fabric Notebook
kustoDf = spark.read \
    .format("com.microsoft.kusto.spark.synapse.datasource") \
    .option("accessToken", accessToken) \
    .option("kustoCluster", kustoUri) \
    .option("kustoDatabase", database_name) \
    .option("kustoQuery", kustoQuery) \
    .load()

# Display the results
kustoDf.show()
This query retrieves 5 records from the MyEventTable in your Eventhouse. Replace the <YOUR_CLUSTER_URI> and <DATABASE> placeholders with your actual cluster URI and database name.
Visualizing the Data
View the Data Inside Eventhouse Using QuerySet
You can view the data directly in KQL by using the following queries:
- Simple KQL Query to View the Data:
Use this query to view the top 100 rows from your
MyEventTable:MyEventTable | take 100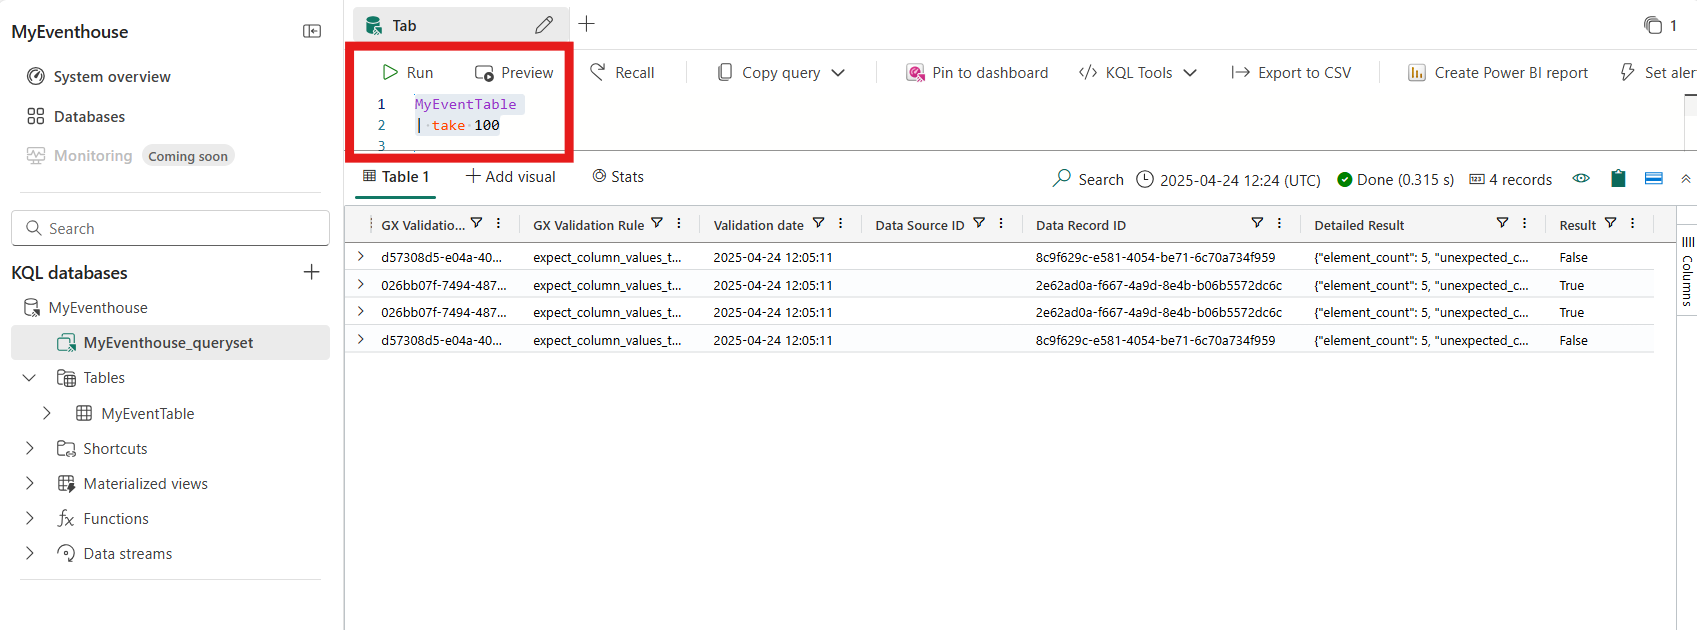
- KQL Query to view Nested JSON Data:
If you have nested data (such as DetailedResult), you can flatten it using KQL:
MyEventTable
| extend result_json = parse_json(['Detailed Result'])
| extend
    element_count = toint(result_json.element_count),
    unexpected_count = toint(result_json.unexpected_count),
    unexpected_percent = todouble(result_json.unexpected_percent),
    partial_unexpected_list = tostring(result_json.partial_unexpected_list)
| project
    validation_id = ['GX Validation ID'],
    validation_rule = ['GX Validation Rule'],
    validation_date = ['Validation date'],
    result = Result,
    element_count,
    unexpected_count,
    unexpected_percent,
    partial_unexpected_list
This will flatten the
Detailed Resultfield and give you an element_count, unexpected_count, unexpected_percent etc.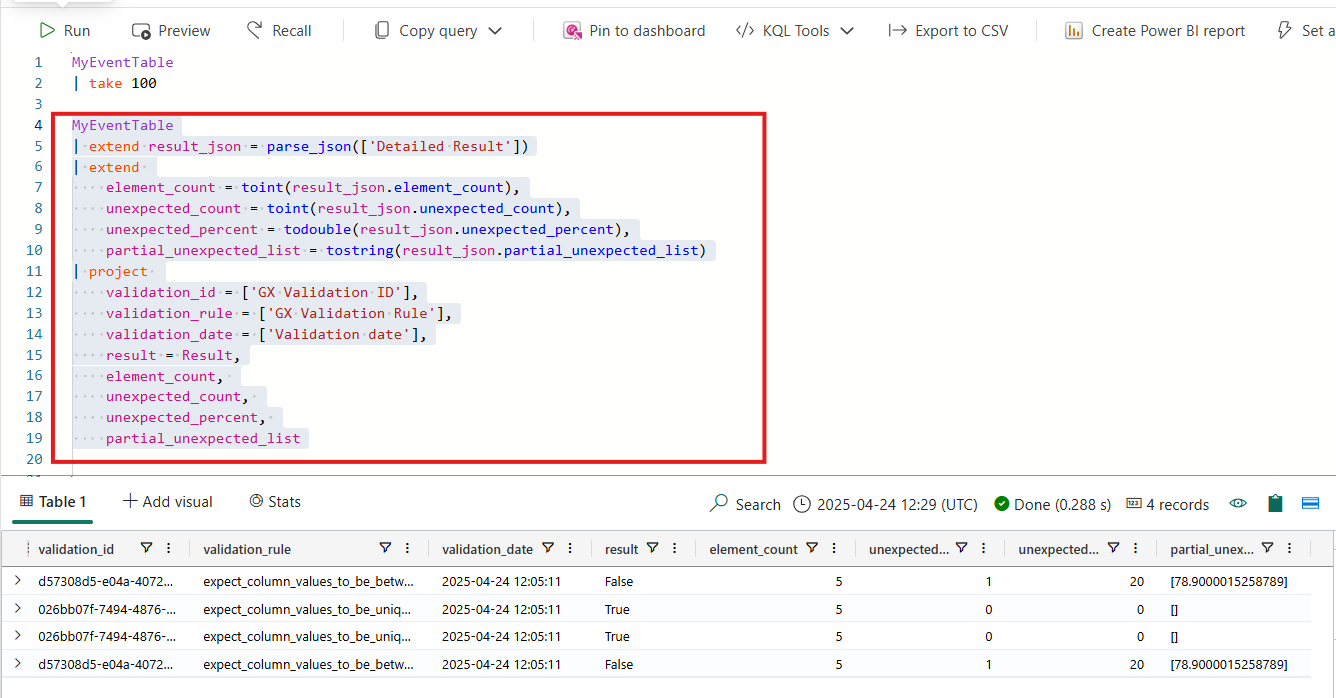
- KQL Query to render the Charts:
You can easily visualize KQL query results as charts in tools that support the
renderoperator, such as KQL Queryset in Microsoft Fabric.MyEventTable | extend status = iff(tolower(Result) == "true", "✅ Passed", "❌ Failed") | summarize total = count() by status | render piechart
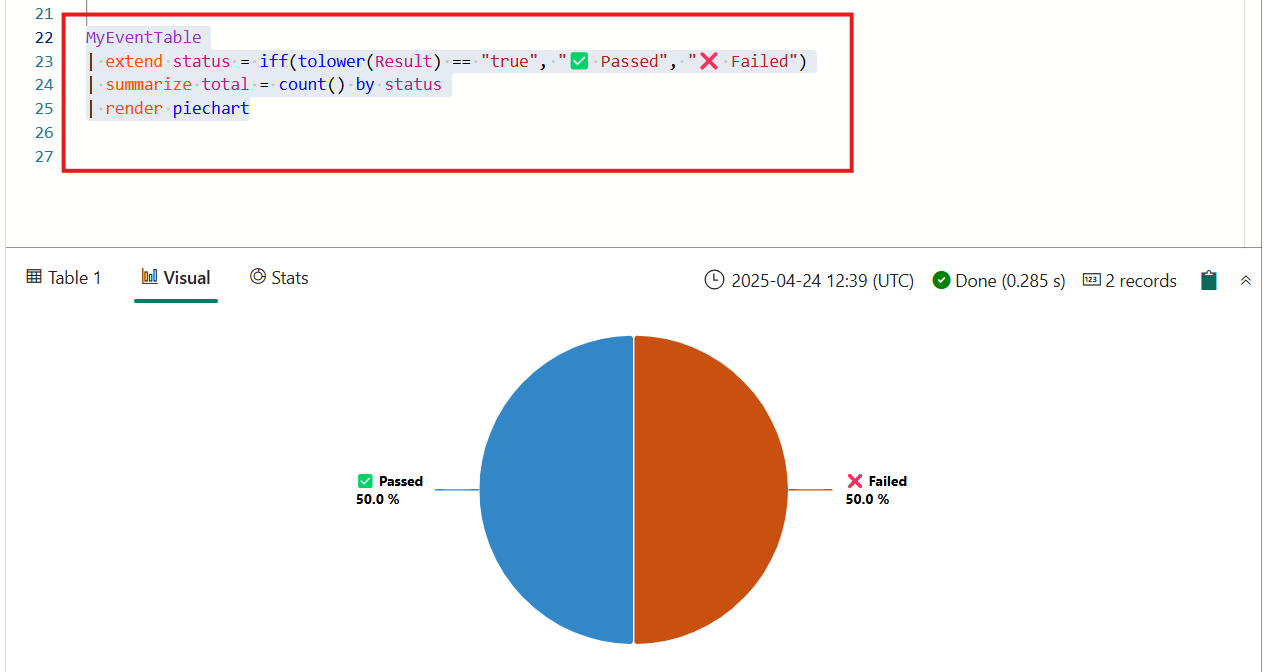
Similarly, you can visualize the data in various formats like bar charts, line charts, scatter plots, or even as tables, depending on the data and the type of analysis you wish to perform.

➡️ Learn more about the `render` operator.
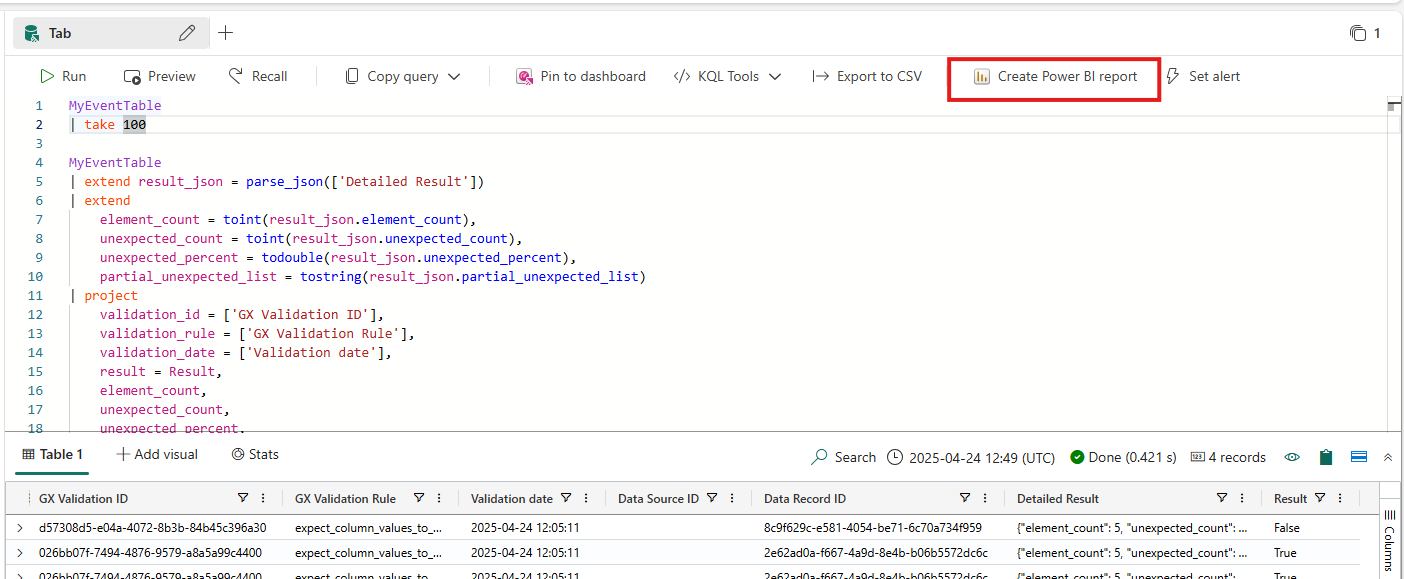
Visualizing Your Data in Power BI
Once your GX validation results are stored in Fabric Eventhouse, you can easily visualize them using Power BI — and the best part is, you can kick it all off directly from the Fabric UI itself!
Steps to Create a Power BI Report from Fabric
- Run a KQL query in the Queryset (inside Fabric).
- Once the results are displayed, simply click on “Create Power BI report”.
- The query results will automatically be used to create a semantic model.
- From there, you can design your Power BI report — add pie charts, bar graphs, filters, and any visuals you like.
This integration makes it incredibly quick and intuitive to go from raw validation results to a full-blown analytics dashboard—all without leaving the Fabric ecosystem.
Conclusion
By integrating Great Expectations with Fabric Eventhouse, you not only store your validation results but also gain the ability to run complex queries, visualize the data, and build powerful dashboards. This setup enables you to monitor your data validation efforts in real-time, providing you with the insights needed to ensure data quality and make informed decisions.
If you haven’t yet explored the possibilities of Fabric Eventhouse and Great Expectations together, now is the perfect time to start. Your data management strategy will benefit from more transparency, easier querying, and the ability to make better, faster decisions.
References
- Great Expectations Overview Learn about Great Expectations, the powerful data validation and documentation tool.
- Fabric Eventhouse Overview Explore how Fabric Eventhouse helps with real-time event processing and storage.
- Kusto Query Language Overview Get familiar with Kusto Query Language (KQL) for querying your data in Fabric.
- Create Power BI Reports from Fabric Eventhouse Learn how to create insightful Power BI reports directly from Fabric Eventhouse data.