Effective monitoring is instrumental in understanding and troubleshooting your modern cloud solution leveraging multiple services. Distributed tracing helps you diagnose issues in your cloud solution by providing the capability to track the flow of a call and the associated latency across these different services.
Today, we announced the public preview of distributed tracing support in Azure IoT Hub. You can leverage the IoT Hub logs with distributed tracing information to monitor the flow of messages through the IoT Hub and troubleshoot problems related to message loss or performance. You can further aggregate these logs to archive them in Blob storage, query the logs through Log Analytics and visualize the data flow in AppInsights as shown below.
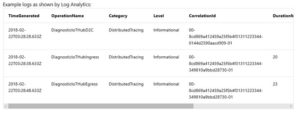
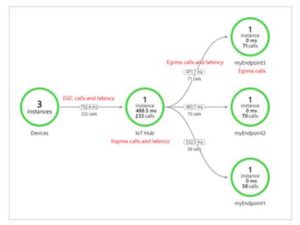
You can now use VS code to enable diagnostics on a subset of your devices and choose the frequency of logging by setting a sampling rate of diagnostic logs per device depending on your business needs. This post provides an outline to configure distributed tracing settings using VS Code. Try it today and let us know what you think.
Before you begin
Please take the following steps to ensure that you are ready to leverage distributed tracing.
- Ensure that you have the Azure IoT Hub Toolkit v2.x.x extension in VSCode. You can install the Azure IoT Tools to get this extension.
- Ensure that your devices have the latest device C SDK and have the code updated to understand the distributed tracing settings. You can leverage the sample client application code to make changes to your device SDK.
Configure device to send diagnostic information
After setting up your devices with updated C SDK, now you can control distributed tracing from Visual Studio Code with the Azure IoT Tools extension in VS Code.
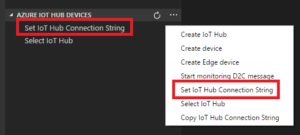
- Expand “AZURE IOT HUB DEVICES” section inside Explorer, and follow the instructions to connect to your Azure IoT Hub.


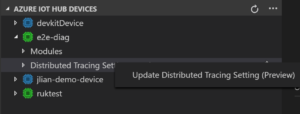
- Create a device or expand an existing device, you can see there is a child node named “Distributed Tracing Setting (Preview)”

- Right click it and select “Update Distributed Tracing Setting (Preview)”

- Now you can enable/disable distributed tracing and set the sampling rate
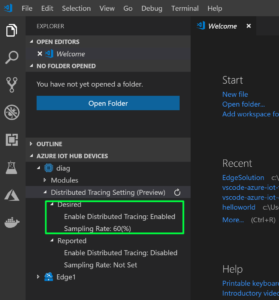
- After setting, you can expand “Distributed Tracing Setting (Preview)” node to see if desired property is set successfully:

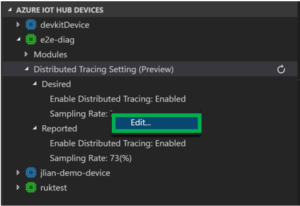
- If your device is connected to IoT Hub, you can monitor reported properties. Once this section is updated, it means your device gets and respects the distributed tracing setting you just set. You can also right click “Enable Distributed Tracing” and “Sampling Rate” nodes under “Desired” to set them separately.

Accessing the logs
Once you have enabled distributed tracing on your devices, you can use the Azure portal to archive your logs to Azure storage, query in Log Analytics or visualize in AppMap. More information about distributed tracing and ways to capture and analyze the logs can be found in our documentation.
You can use this sample to get started on how you can configure and access the logs (and visualize the data) using AppInsights.
More useful resources on Azure IoT Hub
- Azure IoT Tools for Visual Studio
- Wiki page of Azure IoT Hub Toolkit
- Channel 9 video: What’s new in the IoT Hub Toolkit extension for VS Code
- Use Azure IoT Hub Toolkit to send and receive messages between your device and IoT Hub
- Use Azure IoT Hub Toolkit for Azure IoT Hub device management
- Use VS Code as IoT Hub Device Simulator
- Create and control an IoT device connected to an IoT hub (Node.js)
- Create and control an IoT device connected to an IoT hub (.NET)



The link you’ve provided to the device C SDK above (https://aka.ms/azureiotcsdk) leads to a 404 on GitHub, the short link appears to have an extra character at the end when it is expanded.
Thanks a lot Martin, fixed it.