
9 min read · June 3, 2026 · Sebastian Kohlmeier
Shipping an AI agent is the easy part. Keeping it accurate, safe, and accountable in production is where teams get stuck. Agents are non-deterministic. Their behavior shifts as models update, tools change, and traffic patterns evolve and most of that drift happens silently, long after the demo. End-to-end observability covering the full development lifecycle is how you close that gap: See every step an agent takes, evaluate quality and safety against criteria you define, optimize what isn’t working, and prove the business value of what is.
This spring we hit a major milestone — tracing and evaluations in Microsoft Foundry reached general availability with hosted agents coming soon. Every team building on Foundry can rely on them in production today. At Build 2026, we’re extending that foundation to any agent framework, any deployment target, and the full Agent DevOps loop — from the first inference call to the ROI dashboard your CFO will ask about.
This post walks through the key capabilities we’re landing in BRK252 — From observability to ROI for AI agents on any framework: Interoperability, context-specific rubric evaluators that are multi-turn enabled, code-first observability, optimization, and business ROI.
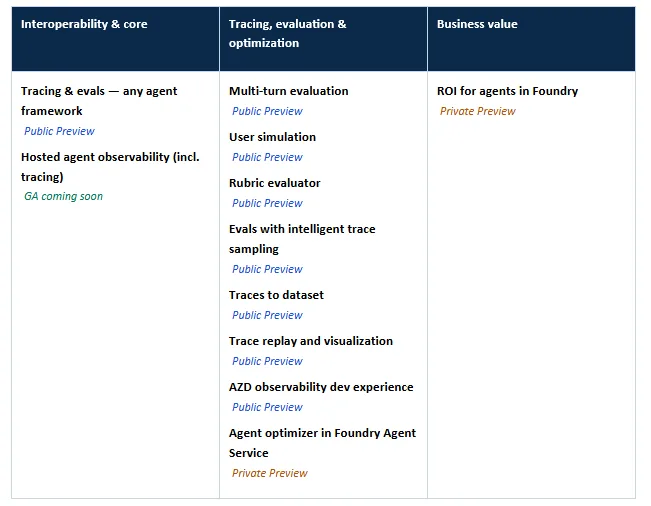
What’s new at Build 2026
All capabilities are part of Microsoft Foundry observability. Preview status reflects state at Build.
Why observability is the foundation for trustworthy agents
Traditional software is deterministic: Same input, same output, same code path. Agents aren’t. The same prompt can take three different tool routes today and a fourth one tomorrow when the model or prompt is updated. That makes the standard reliability stack — logs, metrics, error rates — insufficient on its own. You also need to know what the agent decided, whether that decision was good, and whether it’s getting better or worse over time.
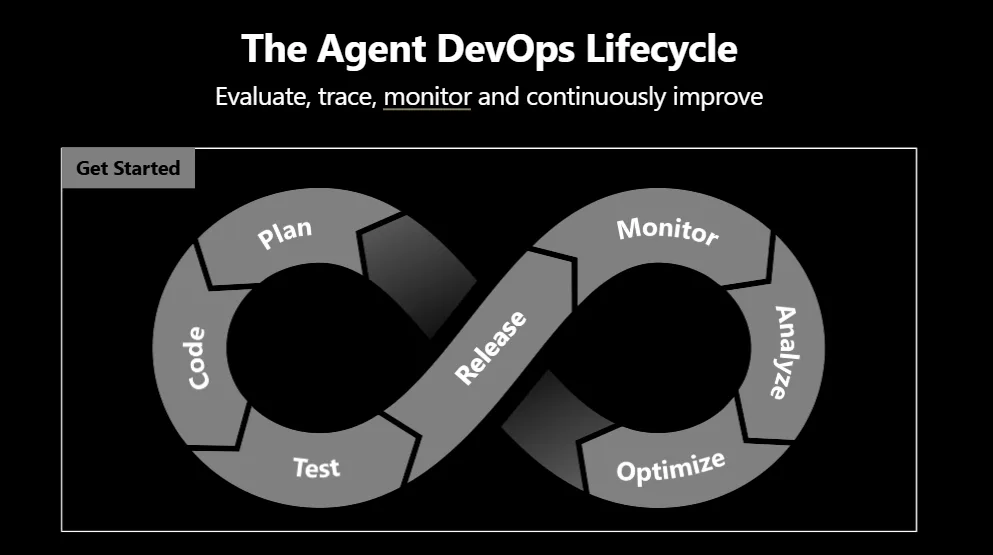
- Foundry observability is built around four capabilities you use continuously across the agent lifecycle:
- Trace — end-to-end telemetry for every step (prompt, model call, tool invocation, sub-agent hop)
- Evaluate — quality, safety, and task-completion scoring at single-turn and multi-turn granularity
- Monitor — real-time issue detection with alerts and dashboards via Azure Monitor
- Optimize — turn production signal into ranked, evidence-backed agent improvements
1. Interoperability: Observe any agent, on any framework
Agents are no longer built in one stack. A single production system might use Microsoft Agent Framework for orchestration, LangChain for retrieval, the OpenAI SDK for a side workflow, and a hosted Foundry agent for a long-running routine. Developers shouldn’t have to choose between the framework they want and the observability they need.
Tracing & evaluations — any agent framework | Public Preview. Foundry’s production-grade tracing and evals now extend to agents built on LangChain, LangGraph, OpenAI SDK, Microsoft Agent Framework, and any custom framework via OpenTelemetry . Every tool call, LLM invocation, and handoff lands in one trace view — regardless of which framework produced it. Run structured evaluations against those traces and get consistent quality signals across your entire agent fleet.
Developer tip: If your agents already emit OpenTelemetry spans, you’re most of the way there. Point your OTel exporter at Foundry, and tracing and evals light up across the framework you already use.
2. Observability: Spanning the full Agent DevOps lifecycle
Agents fail differently than traditional software — context drifts, reasoning wanders, quality erodes over a conversation rather than crashing on a single call. Catching that requires observability as one continuous loop: tracing, evaluation, and diagnosis living inside your workflow — the editor and CLI you already use, not a separate dashboard.
This release threads that loop end to end — a built-in dev experience, tools to pressure-test and score agents before they ship, continuous monitoring in production, visual debugging, and a path that turns real production behavior back into your tests.
AZD observability dev experience | Public Preview. Tracing, logging, and eval insights are now integrated directly into the Azure Developer CLI (azd). Spin up a new hosted agent and observability is on by default when enabled in a guided experience — trace your first run, view evaluation results inline, and diagnose failures without leaving your terminal or VS Code.
User simulation | Public Preview. Generating realistic test conversations by hand doesn’t scale. User simulation automatically produces multi-turn conversations and edge-case scenarios so you can pressure-test your agent before it sees a real user.
Multi-turn evaluation | Public Preview. Single-turn evals miss the failure modes that only show up when context accumulates: tone drift, lost goals, contradictions, safety regressions across long conversations. Multi-turn evaluation scores agent quality across full multi-step conversations — capturing context carryover, reasoning consistency, and end-to-end task success.
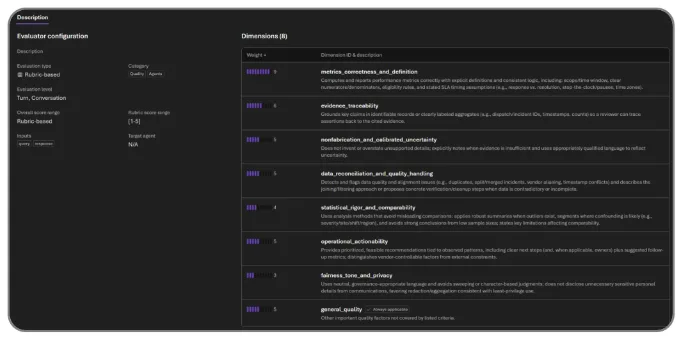
Rubric evaluator | Public Preview. “Good” is different for a vendor history agent, a customer support agent, and a compliance reviewer. Rubric is a new evaluator type that generates context-aware evaluation criteria from your agent’s intended behavior — weighted across task success, tone, safety, cost, and latency — then runs them alongside Foundry’s built-in safety and quality evaluators. The result is a unified scorecard you can run before deployment and continuously in production.
Evaluations with intelligent trace sampling | Public Preview. Evaluating every production trace is wasteful; evaluating none is risky. Intelligent trace sampling automatically runs evaluations against a curated sample of live production traces, using smart filtering to surface the most signal-rich interactions. Continuous quality monitoring without the bill for evaluating every request.
Trace replay and visualization | Public Preview. Step through any agent execution trace visually — prompt, decision, tool call, model output — and replay it to understand exactly how an outcome was produced. Debugging multi-step agents stops is now much simpler.
Traces to dataset | Public Preview. Production traces are the highest-fidelity test data you have. Traces to dataset converts them into structured evaluation datasets you can use offline — closing the loop between what users actually do and what your evals cover.
Developer tip: Wire trace replay into your incident review process. The fastest way to fix an agent regression is to replay the exact trace that broke and re-run it against the candidate fix — not to reproduce the failure from scratch.
3. Optimization: Turn evals and traces into action
Traces tell you what happened. Evaluations tell you whether it was good. Optimization tells you what to change next — and proves the change actually helped.
Agent optimizer in Foundry Agent Service | Private Preview (public preview coming this month) . Improving an agent today is guess-and-check. Ship a tweak, watch users hit failures, try another prompt, hope it sticks. Agent optimizer replaces that cycle with a governed, evidence-backed loop. It reads the agent’s current prompts and skills, searches for configurations that increase quality on your scenarios and constraints, and surfaces ranked candidates with full diffs, lineage, audit trail, and rollback.
Every candidate is evaluated against your rubric and shown side by side — exactly what improved, what regressed, and why. Promote the winner; new traces feed back into evaluation. That’s the closed observe → evaluate → optimize → deploy loop, and it runs continuously.
4. Prove the value: ROI for agents in Foundry
Once teams can observe, evaluate, and optimize agents continuously, the next question gets asked: is this agent worth what it costs? That question used to require a spreadsheet and a lot of intuition. We’re replacing both.
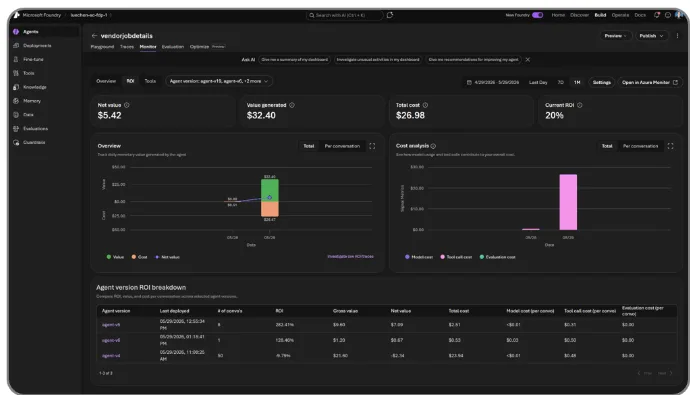
ROI for agents in Foundry | Private Preview. ROI for agents translates the cost of running an agent into the business value it creates — task completion rates, time saved, and cost efficiency — and shows them side by side in the Foundry portal and via API. Compare across versions, track daily trends, and click into low-ROI traces to debug. Stakeholders finally get the data they need to justify investment and prioritize what to improve next.
“By combining evaluations and tracing capabilities in Microsoft Foundry with Azure Monitor, we transform AI into an enterprise-grade, production-ready system with built-in observability and continuous optimization — enabling ongoing evolution across the agent lifecycle and accelerating NTT DATA’s Smart AI Agent® vision.” — Yuji Shono, Head of the Global AI Office, NTT DATA Group
The full loop, in one platform
Each of these announcements stands on its own. Connected, they form the continuous observability loop developers and operators have been asking for:
- Interoperability gives you freedom of framework and one place to see everything.
- Observability: spanning the full Agent DevOps lifecycle makes tracing, multi-turn evals, rubric scoring, and intelligent sampling part of everyday development, so teams can build, test, and iterate faster.
- Optimization closes the loop from production signal to evidence-backed agent improvements.
- ROI turns those improvements into a business case stakeholders can act on.
All of it on the same Foundry control plane, with Azure Monitor for alerts and infrastructure signals, and OpenTelemetry as the common language underneath.
Get started
- Start building in Microsoft Foundry: ai.azure.com
- Get the BRK252 session code: aka.ms/build26-BRK252
- Read the docs: Foundry observability documentation
- Join the community: aka.ms/ai/discord
- Hands-on lab: LAB540 | aka.ms/build26-LAB540
0 comments
Be the first to start the discussion.