

Engineers face a daunting amount of complexity — customer requirements, architecture, monitoring, compliance, security, tools, scale, testing, cost, processes, bugs, incidents, and much more. In this post, I dip into the scale and efficiency investments we’ve made to empower innovation for the 1000+ services across the Microsoft 365 Cloud.
The North Star of the experiences for scale and efficiency takes a page from the autonomic nervous system as inspiration. This part of the nervous system is responsible for control of the bodily functions not consciously directed, such as breathing, the heartbeat, and digestive processes. Could you imagine having to constantly think about making your heartbeat?
This model exemplifies the overall pursuit of many of the investments in the scale and efficiency fabric developed to support Microsoft 365 cloud services. The aspirational desire is for engineers to be at the center of experiences that naturally integrate into the way they do work. While these experiences have not yet achieved the ease of breathing without thinking, they are continuously evolving to make scale and efficiency more natural, in pursuit of a self-optimizing cloud.
Writing efficient code
Traditionally engineers writing code are disconnected from the runtime context and implications on the production environments to which their code will deploy. The process of understanding a production environment (especially from the perspective of performance) is something the engineer must remember to do manually.
To bridge this gap, M365 Core developed the Cloud Profiling and Reporting Pipeline and a set of experiences that connect the development environment with the performance context of the code base’s associated production environment. Through automated profiling and data collection of performance behavior we can now derive the context with which to inform the engineer about the impact of their code, as they write it. These experiences integrate the identification of bad patterns directly in line with the engineer’s code development environment and at the same time provide relative cost that is relatable and meaningful.
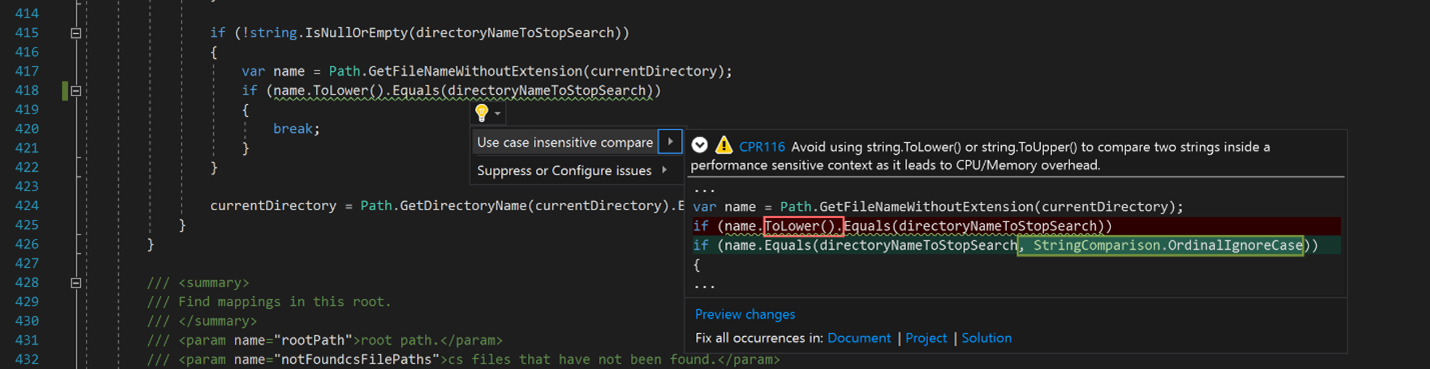
The Cloud Profiling and Reporting Pipeline enables the capture of a vast spectrum of data ranging from CPU, memory allocations, rooted memory, redundant duplicated instances of memory, exceptions, file and path IO, garbage collection stack pause times by generation and reason, block time latency stacks and many others from the cloud. Integrated experiences then surface relevant data within an engineer’s IDE like so:
The integrated and interactive experience takes this even further by allowing the engineer to explore the current runtime cloud costs leading up to the current method of interest and the calls it makes. What is striking here is that the experience is bundling trillions of samples collected from the M365 cloud through the Cloud Profiling and Reporting Pipeline and painting it into a highly accessible canvas for the engineer.

This is complimented with a suite of Roslyn Analyzers to integrate the best-practice coding patterns within the IDE. An extensive library of static analysis rules tirelessly works to help engineers generate optimal code. These have been crafted to codify the knowledge of performance experts, democratizing efficient patterns gleaned from extensive cloud analysis.
The experiences carry forward into the code review process for engineers. Helpful efficiency bots automatically comment on code reviews when potential efficiency opportunities are detected.
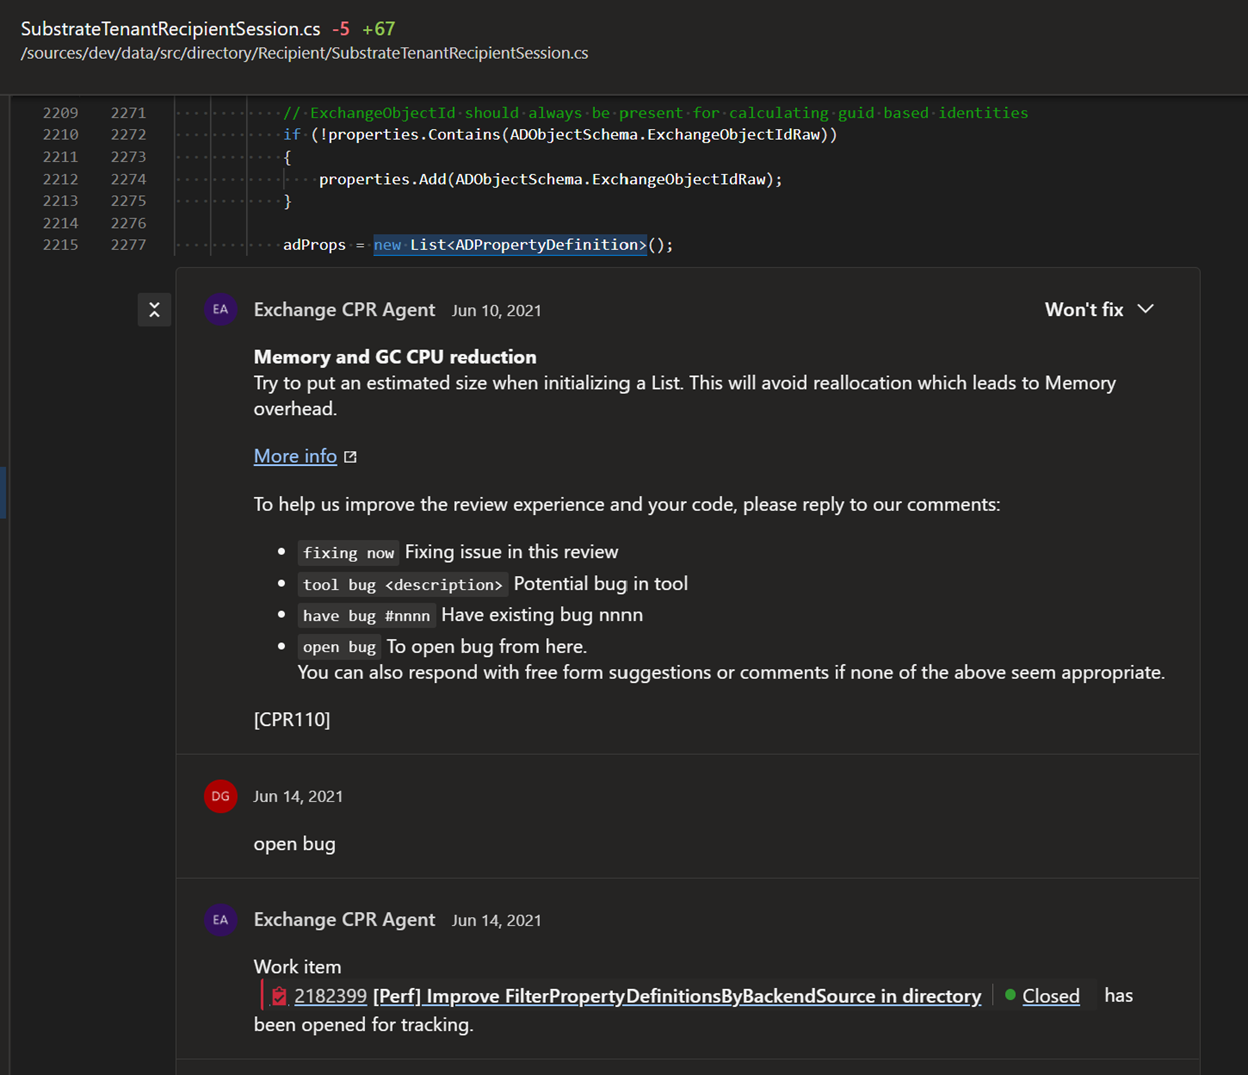
We are working on leveraging process state to be able to make even more exact suggestions on code improvements. For the example above, the average list size can be learned from production data, enabling specific (and optimal) recommendations.
Zoom and enhance: Code-level production anomaly detection of resource changes
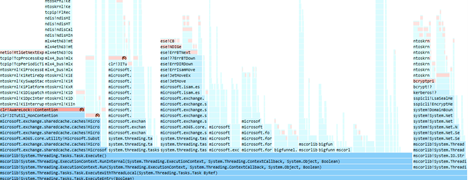
With thousands of code changes committed every week, another key innovation area is seamless detection, isolation, and root causing of efficiency changes as they occur–anywhere across 1000+ services in Microsoft 365. Given the immense scale of Microsoft 365 cloud services, the impact of any one change can be quite large. Autonomous detection of efficiency changes is delivered through the application of robust anomaly detection algorithms applied to the extensive Cloud Profiling and Reporting Pipeline dataset. The result is continuous orchestrated engagement and collaboration across hundreds of teams to resolve issues, generating very material impact to Microsoft’s ability to continuously innovate while delivering fiscally responsible and sustainable cloud services. Heatmaps of the Cloud Profiling and Reporting Pipeline data pinpoint efficiency changes all the way down to the code level.
CPU frames level heatmap of Cloud Profiling and Reporting Pipeline data from an analysis experience for a detected CPU anomaly:

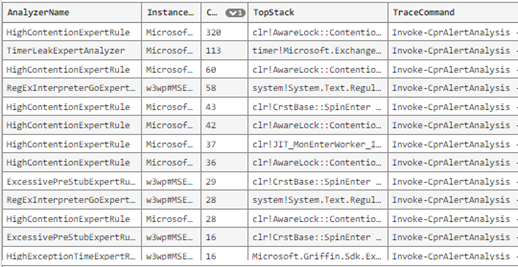
Alerting on the anomalies flows as a connected experience from an event-driven incident management system into customized data analysis experiences providing scoping, issue tracking, automated analysis insights, and frequency distributions. These are designed to further accelerate root causing efficiency changes. Below is a small example of the automated insights surfaced on these data analysis canvases:
Flexible and extensible
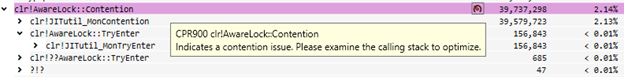
With the flexible and extensible nature of the Cloud Profiling and Reporting Pipeline, there are many streams of data that are collected and available for analysis. Not all of them can be intuitively streamlined into the developer experiences mentioned above. To explore these streams in detail a dedicated data viewer allows the engineer (and the performance expert) to deep dive into all the data collected.
Not only are there a multitude of visualizations to help make sense of the significance, but the engineer can even perform distributed authoring of issues, directly from the viewer, which is then available and seen by all other engineers using the viewer. This is geared towards getting engineers to acknowledge and take ownership of performance issues affecting Microsoft 365 cloud services while simultaneously sharing known issues to the broader engineering community.

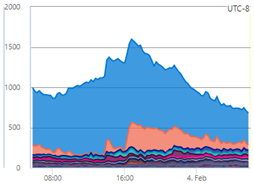
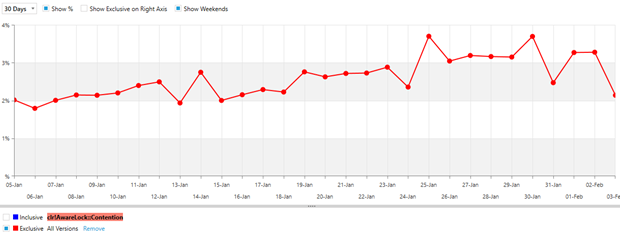
Trending data over time is also a very important scenario that helps provide much needed context to the significance of an issue.
To infinity and beyond: The self-optimizing cloud
Forward looking investments continue the journey towards making the experiences unconsciously a part of bringing great new features efficiently to the cloud. This is an aspirational pursuit of a fully autonomous self-optimizing cloud that will one day be capable of crowd sourcing new emergent efficient patterns from all engineers while virtuously changing existing code to adopt those new efficient patterns without thinking about the process. As machine learning continues to make awestriking progress in Code AI with innovative solutions like GitHub Copilot and PerfLens: A Data-Driven Performance Bug Detection and Fix Platform – Microsoft Research, this world of science fiction becomes increasingly more accessible. Some current tractable investment areas targeting progress towards this dream are already in progress for the next chapter of this journey.
0 comments