

Work flow of diagnosing memory performance issues – Part 0
Work flow of diagnosing memory performance issues – Part 1
Work flow of diagnosing memory performance issues – Part 2 (this post)
In this blog post I’ll talk a bit about how to spend time wisely and then continue with the analysis. Originally I was going to delve deeper into the GCStats view but I actually just debugged a long suspension issue that I wanted to share 'cause it shows some general ideas of what to do when you hit problems during an analysis. You can skip to the analysis part directly if you like.
PerfView isn’t just to collect traces. More importantly, it’s to analyze traces. I’ve come across folks again and again where they collected a trace and that’s the end of usage of PerfView. I would really strongly encourage you to actually use it also as an analysis tool. There’s already an extensive help built in in PerfView. Obviously the main reason why I’m writing this blog series is to also help you with that but with more focus on the memory side. I try to explain why I do things the way I do – the end goal is to help you to get ideas of approaches on how to figure out perf problems; not to list exhaustively all the problems you might hit which would be completely unrealistic.
My philosophy is always that you should be wise about what you spend your time on. We are all very busy with endless tasks to do. I also get that many of us are very independent people and love to figure things out on our own. So how much work do you do on your own before you ask someone for help? These are a couple of rules I go by –
- be generous about spending time to acquire knowledge and skills that will be used often later. If I'm looking at a problem in an area that I will unlikely ever need to look at again, I tend to ask for help sooner 'cause I know the knowledge I acquire here will likely just be used once. But if it's an area I know I will need to solve problems in again, I spend as much time as I can to understand it.
- if I have an urgent problem and there's someone I know who will mostly likely know the answer right off the bat I would ask them for help sooner. And if it's something I think I'll need to know later I will then spend time to understand more details after I get the problem taken care of first ('cause other teams might be waiting on a solution). When I do ask for help, I give the other person a detailed description of the problem and details of all the debugging I've done so far, to save them time to ask for this info.
If you are someone who's a user of the GC, spending a lot of time knowing the nitty gritty details of the GC is probably not the best use of your time; but if you are responsible for analyzing the performance of the product you work on, spending time to learn a few fundamentals of memory and how to do memory analysis benefits immensely – it will give you a lot of autonomy and having autonomy is a great thing 😃
Continuing the analysis
In Part 0 I mentioned I usually request 2 traces to start the investigation. The 2nd trace is to get CPU samples and some other general events like disk/network IO too:
PerfView /nogui /accepteula /KernelEvents=default+Memory+VirtualAlloc /ClrEvents:GC+Stack /MaxCollectSec:600 /BufferSize:3000 /CircularMB:3000 collect
The 1st trace, which is a GCCollectOnly trace, is to get an accurate idea about the GC perf – you want to do this with absolute minimal interference and the GCCollectOnly commandline arg gives you exactly that. This 2nd trace gives you an idea how things are generally running on the machine. GC lives in a process and threads from that process and other processes can affect how GC runs. Note that currently there's no equivalent of this in dotnet-trace – you would need to collect a trace on Linux with the perfcollect script which uses perf+Lttng and unfortunately does not provide the exact equivalent (Lttng has no stacks) but otherwise does give you machine wide view instead of only events from one process that dotnet-trace gives you.
Notice that I'm also specifying the /BufferSize:3000 /CircularMB:3000 args since we are now collecting a lot more events and the default may not be enough. For GCCollectOnly since we know it doesn't collect many events the default is enough. In general I've found 3000MB is enough for both args for this trace. If there’s a problem with these sizes, PerfView gives very informative messages so please pay attention to the dialogboxes it pops up! This is handled by the HandleLostEvents method:
private void HandleLostEvents(Window parentWindow, bool truncated, int numberOfLostEvents,
                              int eventCountAtTrucation, StatusBar worker)
{
    string warning;
    if (!truncated)
    {
        // TODO see if we can get the buffer size out of the ETL file to give a good number in the message.
        warning = "WARNING: There were " + numberOfLostEvents + " lost events in the trace.\r\n" +
            "Some analysis might be invalid.\r\n" +
            "Use /InMemoryCircularBuffer or /BufferSize:1024 to avoid this in future traces.";
    }
    else
    {
        warning = "WARNING: The ETLX file was truncated at " + eventCountAtTrucation + " events.\r\n" +
            "This is to keep the ETLX file size under 4GB, however all rundown events are processed.\r\n" +
            "Use /SkipMSec:XXX after clearing the cache (File->Clear Temp Files) to see the later parts of the file.\r\n" +
            "See log for more details.";
    }
The if case is telling you there are lost events because you were logging too many events concurrently and the buffer is not big enough. So it tells you that you should specify a bigger value via /BufferSize. I generally find the /InMemoryCircularBuffer arg is not reliable so I don't use it.
The else case is telling you that your /CircularMB arg is too big and caused the .etlx file that PerfView generates from the .etl file to be too big and not all of it can be analyzed at once, ie, if you look at the trace in PerfView it will only display you info on the first part that can fit in the 4GB .etlx. This does not mean you need to reduce the size you specified for this arg, it just means you need to take additional steps in order to see all of it. To see the later part you'll need to skip the first part, exactly what the dialog box tells you to do. Often you will see this dialogbox with the 2nd trace. What I do is I look at the GCStats and figure out which time period is of interest and skip the part before that. Note if you look at the trace in the GC perf infra that I talked about in this blog entry, you don't have this problem since the way the infra looks at the .etl file does not go through the .etlx step. This explains why you could see more GCs when you use the GC perf infra than what you inspect it in PerfView.
It's important to specify the /ClrEvents:GC+Stack arg because the default for the runtime collects a ton of keywords –
Default = GC | Type | GCHeapSurvivalAndMovement | Binder | Loader | Jit | NGen | SupressNGen | StopEnumeration | Security | AppDomainResourceManagement | Exception | Threading | Contention | Stack | JittedMethodILToNativeMap | ThreadTransfer | GCHeapAndTypeNames | Codesymbols | Compilation,
Some of these can artificially increase the GC pause time by a lot. For example, GCHeapSurvivalAndMovement, which actually adds another STW pause to BGC and could increase the actual STW pause of a BGC by >10x.
When I know I'll want to concentrate on GC's own perf I would choose to not collect rundown events, ie, add /NoV2Rundown /NoNGENRundown /NoRundown to the commandline which means we are not getting some managed call frames (ie, moduleA!? instead of something like moduleX!methodFoo(argType)) . But if you are doing this as a customer who uses the GC, rundown events are useful so you get managed call frames in your own code to verify if there’s something you can change in your code to help with the perf.
One of the categories of perf problems is the occasional long GCs (you can easily spot them in the GCCollectOnly trace), you can use this commandline to have PerfView stop the trace stop as soon as it observed a long GC:
PerfView.exe /nogui /accepteula /StopOnGCOverMSec:100 /Process:MyProcess /DelayAfterTriggerSec:0 /CollectMultiple:3 /KernelEvents=default+Memory+VirtualAlloc /ClrEvents:GC+Stack /BufferSize:3000 /CircularMB:3000 collect
Replace MyProcess with your process name without the .exe (so if your process is called a.exe, this arg should be /Process:A).
Replace 100 with an appropriate number (so if you want to catch a GC that’s 500ms, replace it with 500).
I explained a lot of these args in this blog entry so I will not repeat it here.
The stop trigger (in this case /StopOnGCOverMSec) is one of the features I really love about PerfView. dotnet-trace currently does not offer this (there's no reason why it can't offer it; it's just work that needs to be done). This is usually what I start with especially if the long GCs are quite reproduceable. It does have a much bigger overhead than /GCCollectOnly but not too much (generally in the single digit percentage) so I can expect the product still runs pretty normally and will keep repro-ing the same problems. I've seen folks chasing different perf problems caused by the Heisenberg effect.
There are other stop triggers. To get help on them, click on Help\Command Line Help, then search for StopOn on the help page. You will see a bunch of them related to various trigger conditions to stop the trace on. The ones related to GC are
- [-StopOnPerfCounter:STRING,…]
- [-StopOnEtwEvent:STRING,…]
- [-StopOnGCOverMsec:0]
- [-StopOnGCSuspendOverMSec:0]
- [-StopOnBGCFinalPauseOverMsec:0]
The first 2 are generic ones so they can be used for any perf counter/ETW event. I have never used the -StopOnEtwEvent trigger manually myself – I can certainly see the potential of this arg but I just haven’t had time to experiment with it.
The last 3 are self explanatory. StopOnGCOverMSec is the most frequently used one. Note that the time StopOnGCOverMSec considers is between GC/Start and GC/Stop, ie, if you specify /StopOnGCOverMSec:500 it means the trace would stop as soon as it detects the time elapsed between a GC/Start and GC/Stop pair is more than 500ms. If you are observing long suspension, you will need to use the StopOnGCSuspendOverMSec trigger which is actually internally implemented with the StopOnEtwEvent trigger to trigger on the time between the SuspendEEStart and SuspendEEStop event pair –
etwStopEvents.Add("E13C0D23-CCBC-4E12-931B-D9CC2EEE27E4/GC/SuspendEEStart;StopEvent=GC/SuspendEEStop;StartStopID=ThreadID;Keywords=0x1;TriggerMSec=" + StopOnGCSuspendOverMSec);
Long suspension
Now onto the customer issue I mentioned I just debugged – from the GCCollectOnly trace we could see there are some GCs that spend a very long time in suspension (3 to 4 seconds!). I also had them collect the 2nd trace and looked at the CPU samples during these long suspensions. Note that when this happens, only suspension is long, the GC part is normal. There's a different scenario which is both the suspension and the GC are randomly long or one of them is. This generally points to something that is preventing the GC threads from running. The most common cause is where there's a process running with high priority threads (often unexpected) on the machine that does this.
In this case we already verified that the problem always only exhibits in suspension. And from the 2nd trace I could see there's some IO going on which I know might prevent suspension till it’s done. However, this is based on the knowledge that I already had. If I didn't know, what could I do to verify this theory? Also I’d just like to show the customer exactly how this prevents suspension. This is where a yet heavier weight trace comes in play, the ThreadTime trace. If you have a thread that's not finishing it work, either that work just takes a long time, or something causes it to block for a long time. If it gets blocked, at some point it'll wake up and we want to know who woke it up. Collecting the Context Switch and the Ready Thread events gives us exactly that – to see why a thread gets switched out and who enabled it to run again. This is called a ThreadTime trace in PerfView lingo. What it collects is just the Default kernel events plus these 2 events. So you would replace /KernelEvents=default+Memory+VirtualAlloc with /KernelEvents=ThreadTime+Memory+VirtualAlloc. These Context Switch and Ready Thread events are very voluminous so sometimes the original problem no longer reproed but in this case the same problem reproed.
Please see PerfView's help for the explanation of using the ThreadTime trace. When you have the Ready Thread events, an additional view is lit up in PerfView called the "Thread Time (with ReadyThread) stacks" view under "Advanced Group". What we normally do is open up this view and search for calls that are blocked during the time period it was blocked and see its "READIED_BY" stacks which caused the thread of interest to wake up. So what I did was copy the time period 384,026.930 to 387,822.395, which was how long suspension lasted indicated by GCStats, and pasted that into the Start and End textbox in this view. Then I search for suspend in the Find textbox and clicked on Callees. And this is what I see –
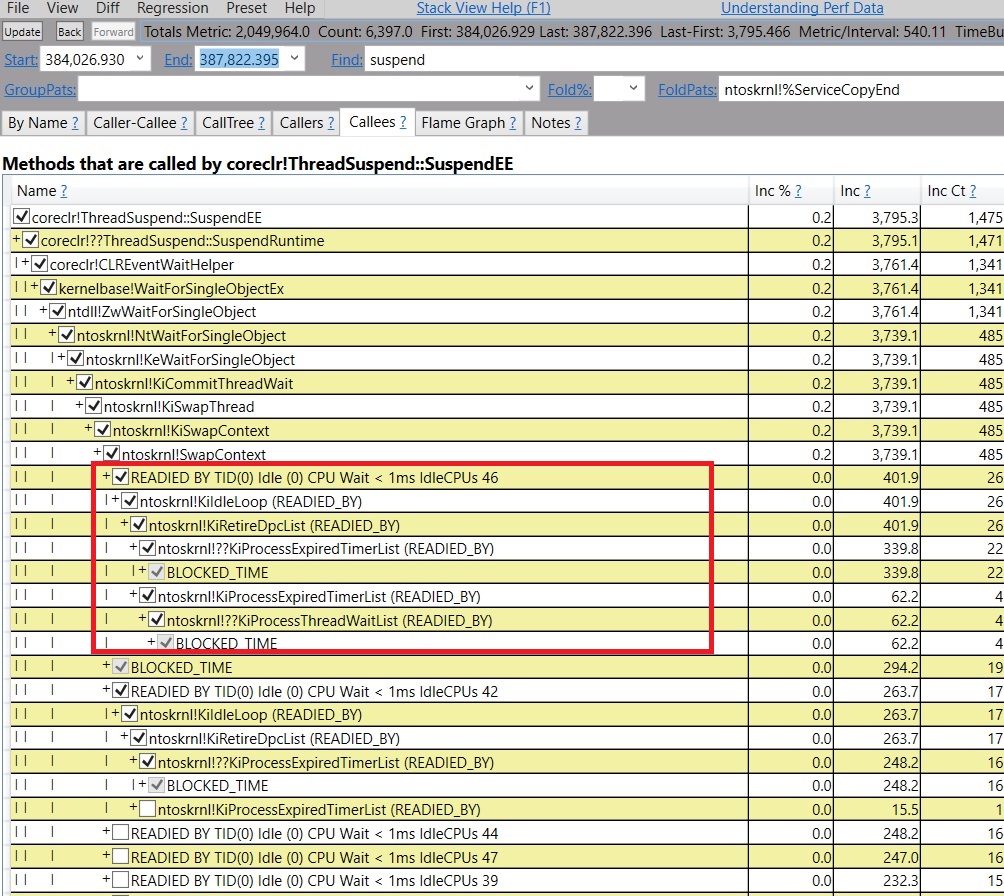
I was hoping to see a READIED_BY stack that woke up the thread that called SuspendEE, and there indeed is one but it's not useful because it doesn't show me a deep enough stack that leads to something that's in the code I work with or my customer's code. It's still just in ntoskrnl.
So at this point, I could either ask the PerfView owner to take a look (it was late at night; and even if he responded at that time he may not have time to look at it right away and this doesn’t look like a trivial thing to fix. And I really wanted to get this problem figured out 😀), or I could figure out some other way to make more progress on my own. When a view that's designed for a certain category of problems doesn't work, there's always one view to come to rescue, which is the Events view. Of course there could be other tools that could work for this, eg, WPA. But last time I used WPA seriously was years ago and the UI is vastly different from what I was familiar with.
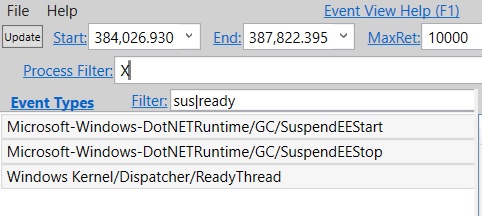
The Events view is a raw version of the Events the .etl file includes (this is not strictly accurate, PerfView still does a bit of processing for some events; but for the most part it's pretty raw – you get the name of the events and the fields for each event). And I'm most interested in the ReadyThread events which tell me which thread is woken up by which other thread. So the first thing I do is to filter to only the events I want to see otherwise there are way too many of them. I open the Events view and again put in the Start and End timestamp as I did with the other view, and in Process Filter I put in the process of interest (to protect privacy I just use X for illustration purposes). In order to filter to only suspension and ReadyThread events I put in sus|ready in the Filter textbox. This will only include events whose names include either "sus" or "ready" –
Now select the 3 event names and press enter. And now we only see those 3 –
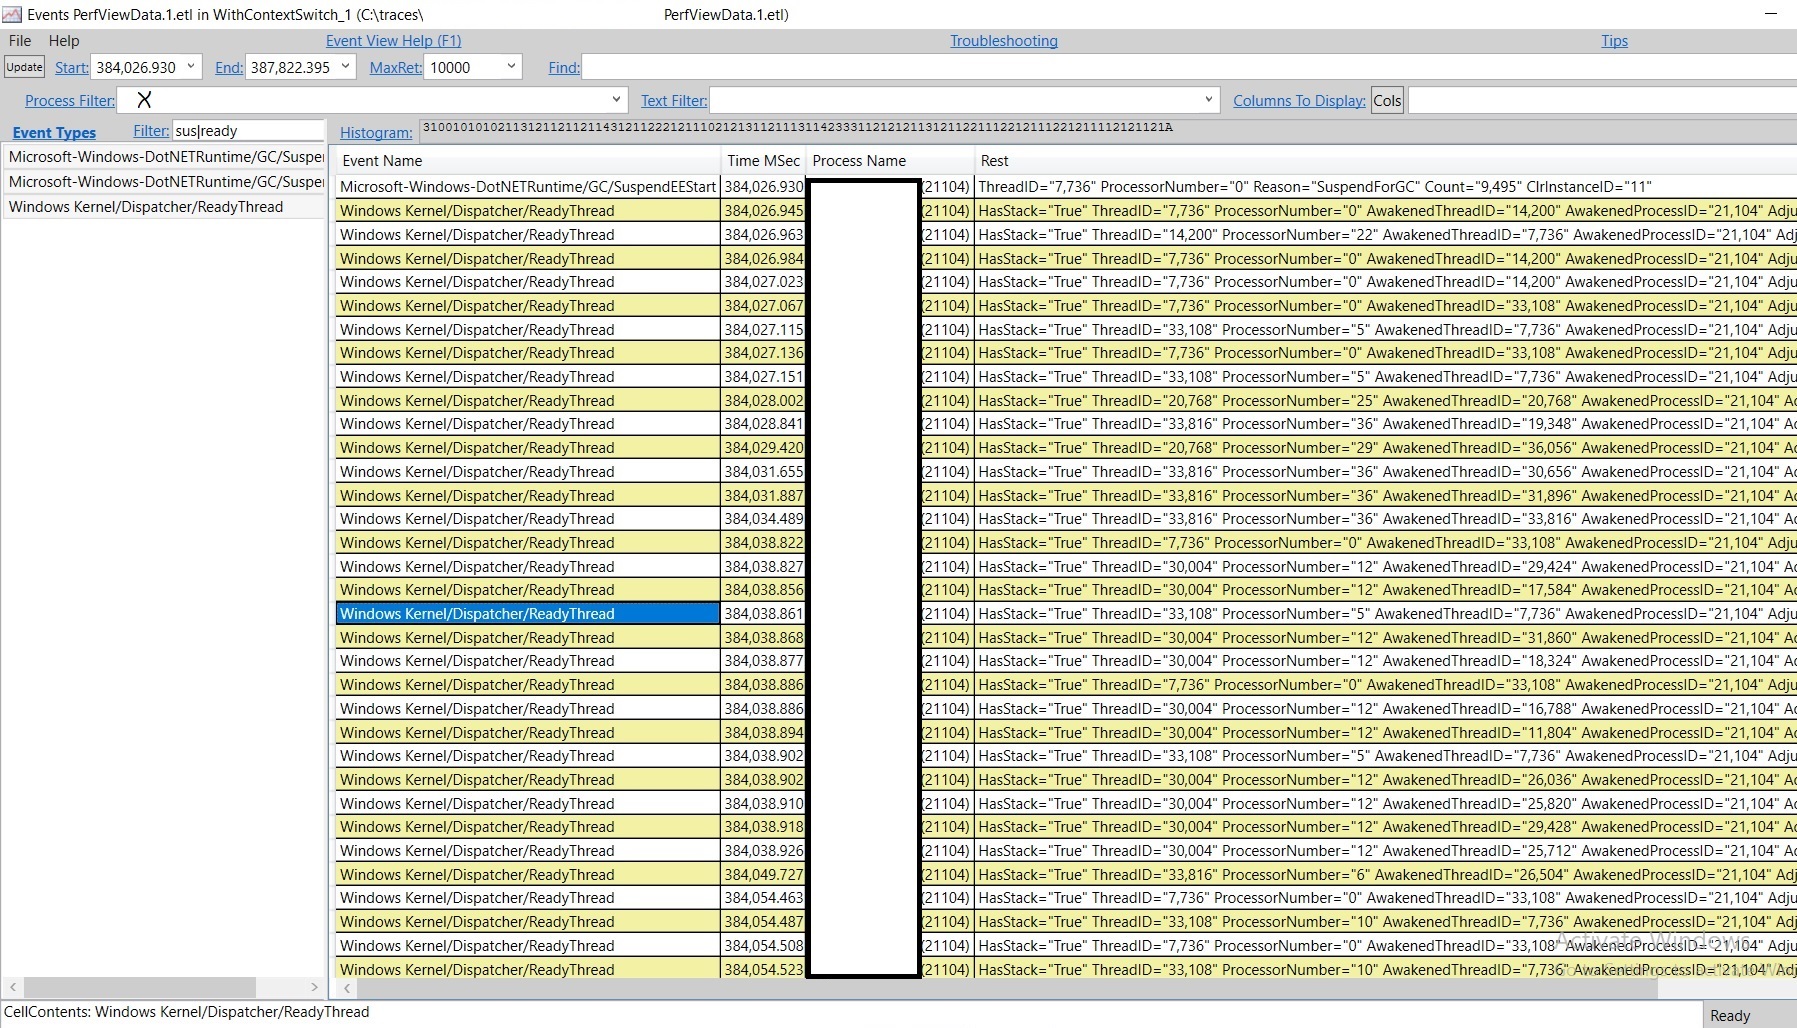
There are a lot of them; and we are only interested in the ones that woke up our thread which is the GC thread in this case (in Server GC SuspendEE is always called from heap0's GC thread) with the TID 7736. It's hard to inspect this manually so we wanna filter to only the interesting ones. The way to do this is to have the Events view show us the fields of events in separate columns so we can sort – by default it just shows all fields in one column. We do this by clicking on the Cols button (next to "Columns To Display") and select the ones we want to display. I selected 3 fields –

And now it displays those 3 fields and then I sorted by AwakenedThreadID and looked for our thread 7736.
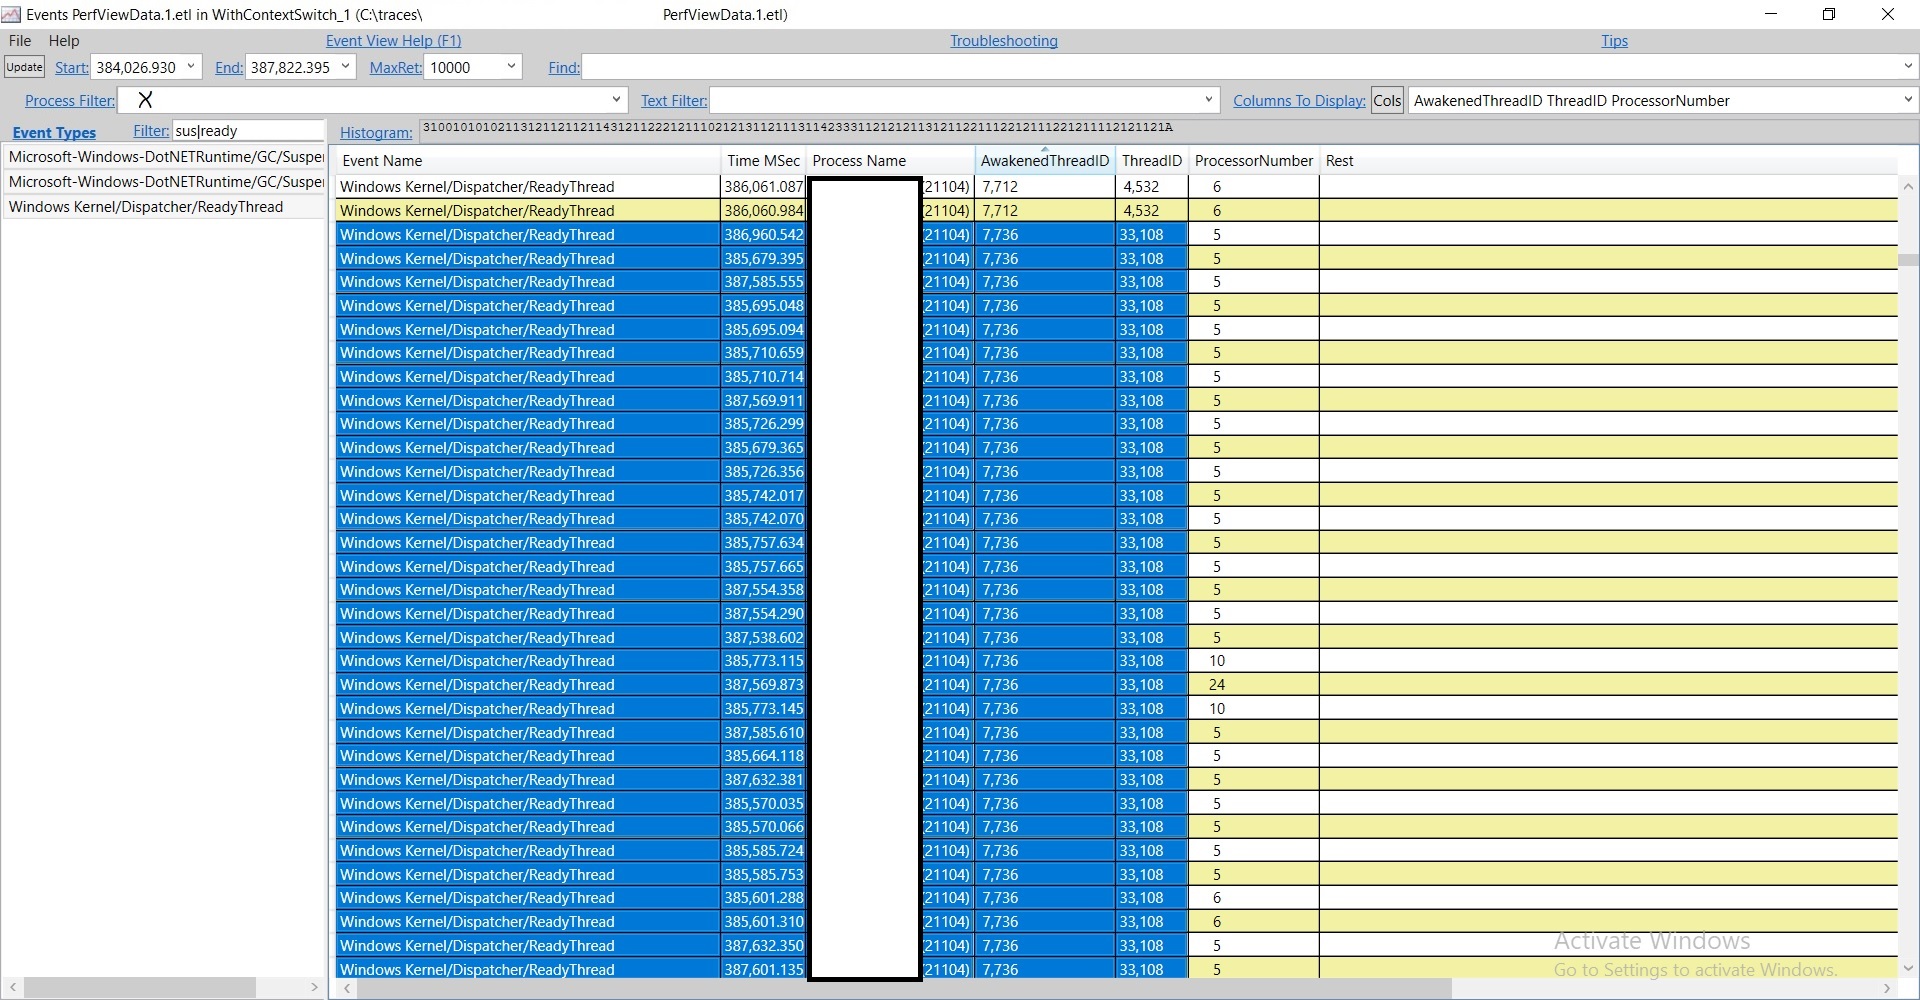
Sure enough, there's a problematic thread – thread 33108. If I click on one of these timestamps, and press Alt+S (meaning to open Any Stack associated with this timestamp; you can also get to this via the context menu), I see this stack –
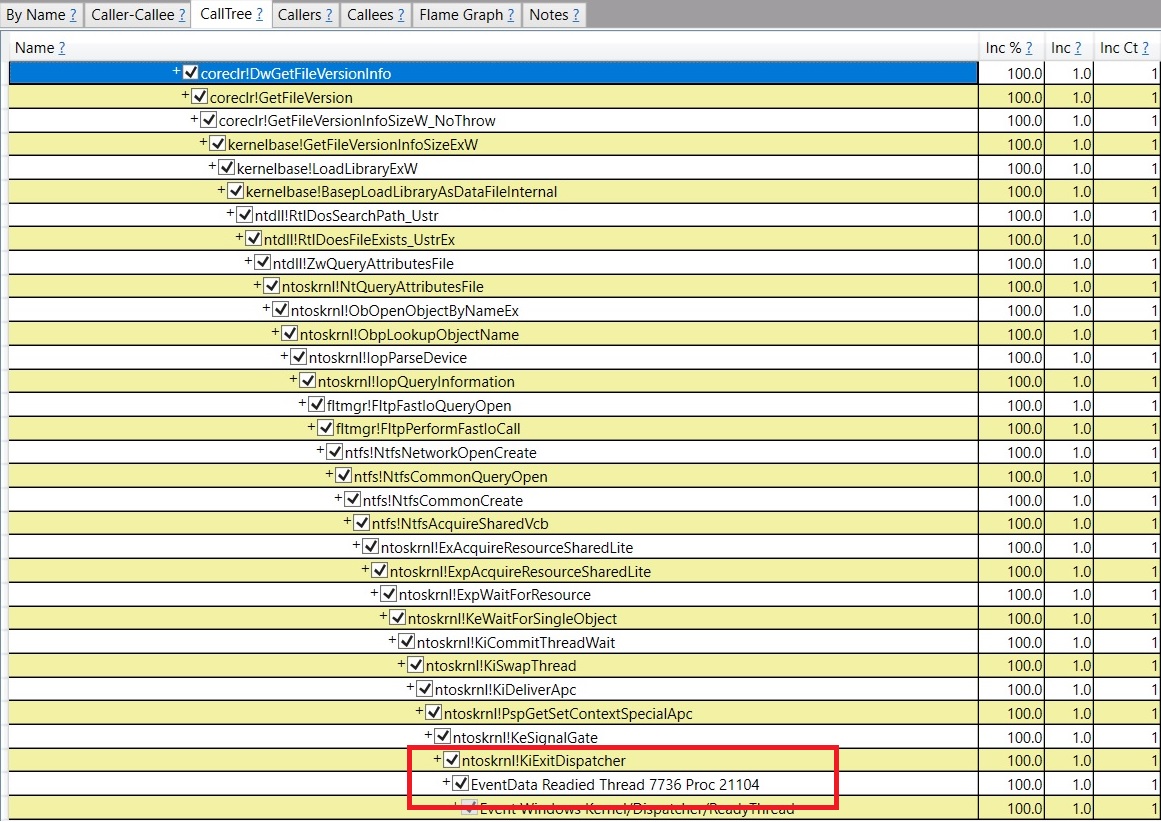
At the bottom it says "Readied Thread 7736". And other timestamps pretty much all have the same stack. I'm only showing the part inside the runtime but for the part that's inside the customer's code it's always an exception throw from the same dll. It turned out this is a bug in our suspension code – it should have switched to preemptive mode before calling out to the GetFileVersionInfoSize OS API. My guess is since this is a code path for handling exceptions (the exception handling code called coreclr!DwGetFileVersionInfo at the top) it wasn't exercised as much so we didn't notice it till now. A workaround for the customer would be to avoid having their dll throw these exceptions which will make it not call into this runtime code path.
That’s all for today. As always, let me know if you have any feedback!
Great article series! Really interesting stuff.
The one difficulty we have diagnosing these kind of issues is that all our code runs in an Azure App Service. Are we able to run PerfView like you show in these articles? I was having difficulty following along with the commands you are showing in the Azure environment.. Running the code and PerfView on my machine is always an option, but usually, our issues only appear when running in our production environments that have a much higher load.
AFAIK from working with folks who run their products in Azure, there's no technical difficulty to run these commands. the difficulty usually comes from the fact they have very strict policy what they are allowed and now allowed to run in their VMs. for example, some teams would need to whitelist perfview.exe in order to run it. I'm not sure if this might be what you are hitting? also all you need is to run the command to collect traces in your VMs; you can always analyze them on a different machine (most of what I talked about is about...
Nice series! I wish we had more of this.
thank you! there will be more to come, I just need to find time to write 🙂 (which is quite difficult unfortunately)