This post was written by Microsoft Explorer interns Daniel King, Zoë Petard, and Jessica Petty and highlights their project & experiences this summer working on the .NET Roslyn team. We loved having them this summer!
Roslyn Diagnostic Analyzer Tutorial
Tired of frustrating compile-time errors? Analyzers can examine code as you type and present live diagnostics.
Wish you could standardize code across your organization? Analyzers can enforce coding protocols during code production instead of at code check-in.
This blog post will explore how analyzers work and walk through the analyzer tutorial that we wrote.
Our project
This summer we had the amazing opportunity to be part of Microsoft’s Explorer Program–a 12-week rotational internship for students who want to explore their budding interest in computer science. As Explorer interns on the .NET Roslyn team, our summer project was to create a tutorial to help non-compiler-savvy developers understand and write simple live-code diagnostics (aka “analyzers”).
The objectives for our project at Microsoft were two-fold:
- Create an easy entry point for someone to learn about analyzers and their potential
- Explore the possibility of using analyzers as a teaching tool
We achieved these goals by writing a meta-analyzer that served as a tutorial for writing an analyzer. In other words, we created a step-by-step tutorial using the diagnostic squiggles and light bulb code fixes in Visual Studio.
What are analyzers?
Analyzers leverage the power of the open source C# and VB compiler project, called Roslyn. Compilers are generally thought of as “black boxes” that take in source code and produce assemblies, hiding a lot of useful information built up by the compiler. The Roslyn project exposes this information via APIs, which developers can take advantage of to write code-focused tools. For example, an organization could write a tool that would enforce coding guidelines at edit-time, rather than going back after code is checked in and trying to fix mistakes.
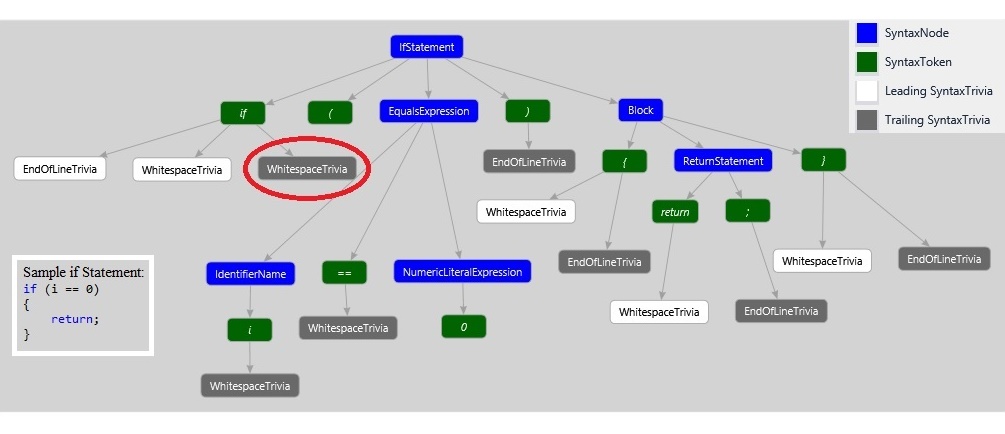
Analyzers highlight potential problems in your code by producing live diagnostics within Visual Studio. An analyzer works by examining the syntax tree and semantic model of a piece of code, and then providing feedback on that code. A syntax tree is a full fidelity, immutable representation of the code. In other words, the syntax tree has every grammatical construct, every syntax token, and everything in between, meaning that the original text of the code can always be recovered from a syntax tree. A semantic model, on the other hand, provides a higher-level representation of the code. It contains useful information about references and imported libraries. The analyzer can take information from both the syntax tree and the semantic model to provide live feedback
Walkthrough
Instructions and Overview
We’ve put together a screencast walkthrough of our tutorial. The tutorial introduces you to the basic components of an analyzer, while guiding you to write your own analyzer that enforces the placement of a single space between the if-keyword and opening parenthesis of an if-statement. An image of the syntax tree, created using the syntax visualizer, of an if-statement can be seen here:

Instructions on how to access the tutorial and run it on your machine to follow along with the screencast can be found on the GitHub page.
Screencast
If you’ve followed along to the end of the tutorial, congratulations on writing your first analyzer! By running your project, you’ll be able to see squiggles generated by your custom analyzer when there is incorrect spacing between an if-keyword and the opening parenthesis of an if-statement.
While this analyzer is fairly simple, analyzers have the potential for solving a wide range of more complicated code issues. Analyzers can have a deep understanding of the underlying code and use this knowledge to identify more subtle problems. For instance, analyzers could identify and handle exceptions before build, guide a developer on best practices, or identify security holes in a program. Examples of more sophisticated analyzers can be found on the GitHub page for analyzers.
Internship Reflection
When we were told that our intern project would be to teach people how to write tools that we ourselves had never written or used, we were admittedly a little intimidated. In the end, our lack of experience gave us greater insights into the struggles faced when being introduced to analyzers.
Throughout this internship experience, we discovered the ins-and-outs of syntax trees and semantic models, organized and acted on constructive feedback, and explored the limits of our individual and collective skills and horizons. Most importantly, we learned how to work as team and utilize our individual strengths and confidences to create a product that we can all be proud of.

Daniel King is going into his second year at Harvey Mudd College in Claremont, California. A Seattle-native, this is his second internship at Microsoft and his first as an Explorer Intern.
Zoë Petard is starting her fourth year at McGill University in Montreal, Québec. She loves climbing, canoeing, and all things outdoors.
Jessica Petty is going into her third year at the University of Colorado in Boulder, Colorado. She enjoys hiking, long walks on the beach, and beluga whales.

0 comments