Standardizing on ETW
In 4.5 we introduced ETW tracing for WCF. In the past couple of months we have been trying to establish some common tools that can be used to debug and analyze ETW traces from WCF. We have a large number of tools that allow ETW analysis and the one aspect we wanted to do was to allow activity correlation which WCF uses extensively. Folks who have already used ETW in its full capacity already know about ETW activities and how they are propagated. Those of you who don’t, this FAQ: Common Questions for ETW and Windows Event Log should be a good start point. Others who just want to jump in, hop over to the tool page here –http://svcperf.codeplex.com/
Pros of ETW
- Ability to control it dynamically compared to System.Diagnostics
- One of the fastest tracing mechanisms in the Operating System
- Well understood formats of producing and consuming traces.
- Inherent concepts of Activities and correlation.
- Real-time analysis capabilities, even in production environments.
Some of the not so great features are
- Lot of tools available which causes confusion in the tool to be used.
- Cannot be easily read with text analysis tools due to binary format of the file
- File format can be better optimized.
- Collection is machine wide and can impact the system if there are large number of WCF services on the box.
Despite these issues ETW offers one of the most robust tracing infrastructures on the platform. With that in mind we build our End-to-End(E2E) tracing for WCF. We needed to make multiple layers understand and consistent with our E2E model. We also needed to be able to correlate a large number of scenarios from our transports all the way to our dispatchers. We have large number of pumps in multiple layers and being extremely asynchronous means that you lose the ability to depend on things like TLS and ExecutionContext etc. With these in mind we choose a model where we explicitly flow our correlation across layers and use it when stamping our events. This also means that we need to be able to stitch causality chains for request analysis.
- Note: This does not deprecate Diagnostics Tracing and neither is it guaranteed to provide feature parity. Instead we consider this as new capability which we can use for production analysis cases where we would not like process restarts or configuration changes to running applications. Also for 4.5 we do not have message logging which still requires configuration and can be done only through Diagnostics Tracing.
Why do we need another tool?
The other more popular ETW tools like Xperf and WPA have a good amount of analysis capability already built in them but they are not tuned for statistical analysis of data. For e.g. given a trace how do you find out which are your slow requests or how to obtain a distribution of your request processing times. These kinds of question were better answered with SQL like queries. That said there are log parsers that have this capability but we wanted to work on raw ETL and this is where SvcPerf comes into play. Besides being a quick ETL viewer it also is a query engine built on top of Tx (LINQ over Traces).

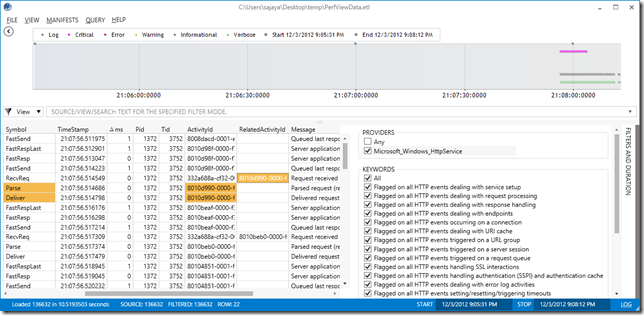
In the above screen shot you can see that Activities are correlated for you and the ETW fields like ActivityID and RelatedActivityID are can be directly queried.
If you want to just give the tool a try you can get it from here. SvcPerf.exe (It is self-signed and will give you a warning but if you want you can try to compile the source as well provided you remove the strongname.).
To collect the trace use logman with the WCF provider and you also need the manifest so that events can be decoded. Refer – http://svcperf.codeplex.com/wikipage?title=How%20do%20I%20collect%20an%20ETL%20trace%20for%20WF%2fWCF%3f&referringTitle=FAQs
In the coming posts I will try to take up some simple scenarios where this tools might help in analysis.
- Request Duration analysis and Drill Downs
- Custom Queries and Graphs
- Synthetic Performance Counters
- Template Queries

0 comments