Late last year, Vance Morrison, who is currently an architect on the .NET Framework Performance team, released PerfView, which is a new performance tool for .NET developers. PerfView helps you discover and investigate performance hotspots in .NET Framework apps, and enables you to deliver consistently high-performance apps to your customers.
Using PerfView, you can perform complex CPU performance analyses to solve hard-to-detect performance problems. PerfView’s revolutionary grouping and folding features are what makes it possible to grasp and solve these difficult problems.
PerfView can be used for any app on Windows, including ASP.NET and Windows Store apps. While it works great for .NET Framework apps, it can be used for native and JavaScript apps, too. It supports all .NET Framework versions, including the .NET Framework 4.5.
Vance tells us about PerfView
Vance took some time to tell us more about PerfView in the following Channel 9 video. He explains why he built PerfView and how it works, and demonstrates its use.
How can I get PerfView?
You can download PerfView from the Microsoft Download Center. It is a very quick, easy and free installation. It’s just an EXE in a .zip file. You can also check out our series of PerfView Tutorial videos on Channel 9.
What can PerfView do for you?
PerfView was designed to collect and analyze both CPU and memory scenarios. It provides the following features:
- CPU investigation:
- Enables you to diagnose the cause of excessive CPU use:
- GC Stats view for understanding the garbage collection costs in your app.
- JIT Stats view for understanding the JIT costs in your app.
- Provides aggregate call stacks of your app over time.
- Helps you quickly sort through all the stack data collected, to find the root cause of a performance issue.
- Enables you to diagnose the cause of excessive CPU use:
- Managed memory investigations:
- Enables you to diagnose the cause of excessive memory use.
- Provides snapshots of the .NET Framework garbage collection (GC) heap, including large heaps.
- GC samples are displayed in the same stack viewer used for stack traces, enabling the same approach to be used to investigate memory use issues.
- Blocked time investigations:
- Enables you to diagnose latency issues in your app (for example, waiting on the network).
- Provides visualizations that show why your program is waiting.
PerfView provides access to rich performance data through a set of powerful views. Don’t be surprised if you find the tool a little complex at first. You will likely find the Performance Profiler in Visual Studio 2012 easier to use. It’s up to you when to use either tool. We think PerfView is a great tool to use when you need to get a bird’s eye view of what’s really going on in your app.
Let’s take a look
PerfView provides several different experiences for conducting performance investigations. These largely relate to the investigation types listed above. We’ve provided a brief preview below; you can also download PerfView to try these features yourself.
Note that the screen illustrations below do not cover all PerfView features, but are intended to provide you with a flavor of what PerfView has to offer you.
Home screen
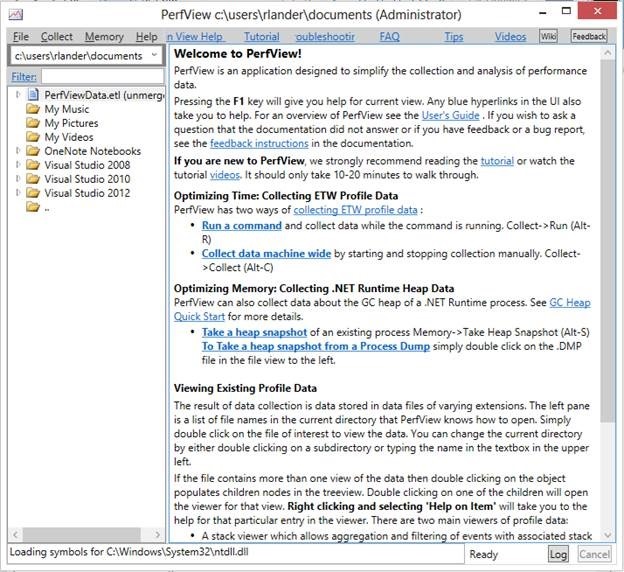
The PerfView home screen provides you with a starting point to access tool features, helpful documentation, and videos.
PerfView trace collection
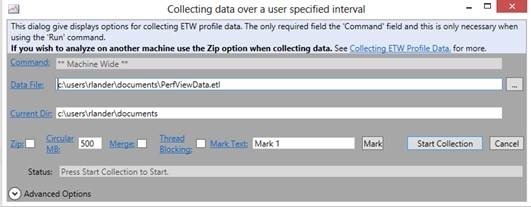
You can access the trace collection dialog box by clicking Collect from the menu on the home screen. This dialog box enables you to collect a trace, and is where you start for most investigations. Click Start Collection to start sampling the user scenario that you want to investigate, and click Stop Collection when you are done.
PerfView analysis type selector
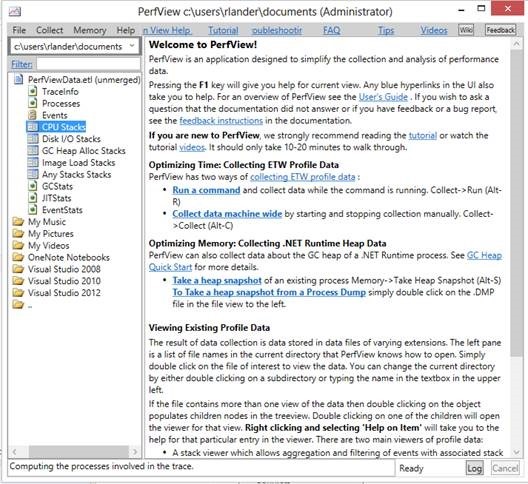
Once you have collected a sample, a selection of analysis types (CPU stacks, GC stacks, etc.) appears in the PerfView window’s left pane. You double-click the information that you are interested in.
PerfView process selection window
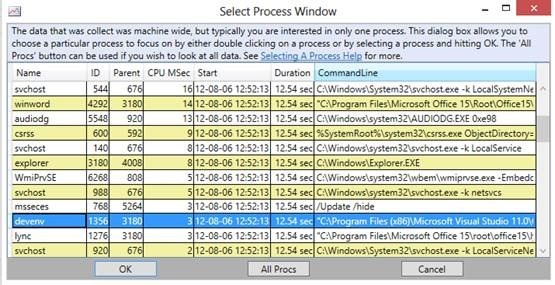
PerfView scopes your view of the collected data to a process. You need to select the process that you are interested in investigating. Although PerfView was written primarily for .NET Framework apps, you can also investigate native and JavaScript apps. PerfView typically operates at a machine-wide scope, so you will see a long list of processes in this dialog box.
Stack viewer
The stack viewer is the primary UI that you will use in PerfView. It provides a list of aggregate stacks encountered during sampling. The stack viewer includes all the method frames that were seen during the course of the sample. By default, the frames are ordered by the number of times they were seen, which correlates to the amount of time spent in those methods.
GC heap dump viewer
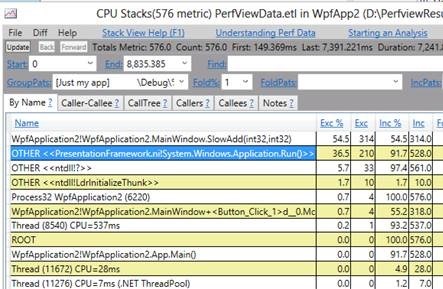
The GC heap dump viewer provides information on the objects that are allocated to the managed heap at a specific point in time. You can take a heap snapshot by using the Memory menu in the PerfView home screen. You can quickly determine the largest allocations in your app, described by type. The GC heap viewer uses the same view and similar columns as the stack viewer above.
Using Perfview to investigate performance hotspots
PerfView was built to help you investigate performance hotspots. To demonstrate this feature, I will walk you through two performance investigations. One is completely contrived and is intended to show the most basic use of PerfView. The other is a real app that has actual performance problems. Don’t hesitate to download PerfView and try it on your own apps.
Investigation 1: Analyzing a simple, contrived app
I created a very small app that has a performance problem. This is a Windows Presentation Foundation (WPF) app with a single button that kicks off a very tight loop. This loop calls a very slow operation with every 20 iterations of the loop. My reason for creating this app was to demonstrate how PerfView displays performance hotspots when we know what to look for.
This test app spends the entirety of its time in a loop. For every 20 iterations of the loop, the FastAdd method is called 19 times and the SlowAdd method is called once. SlowAdd is the method that leads to an artificial bottleneck in the app. Do you think that PerfView will notice? Here’s the code for the two methods, both called from the loop in the button handler:
Int32 FastAdd(Int32 i, Int32 i2)
{
    return i + i2;
}

Int32 SlowAdd(Int32 i, Int32 i2)
{
    Int32 sum = 1;

    for (Int32 j = 0; j < 10000000; j++)
    {
        sum *= j;
    }

    return i * i2;
}
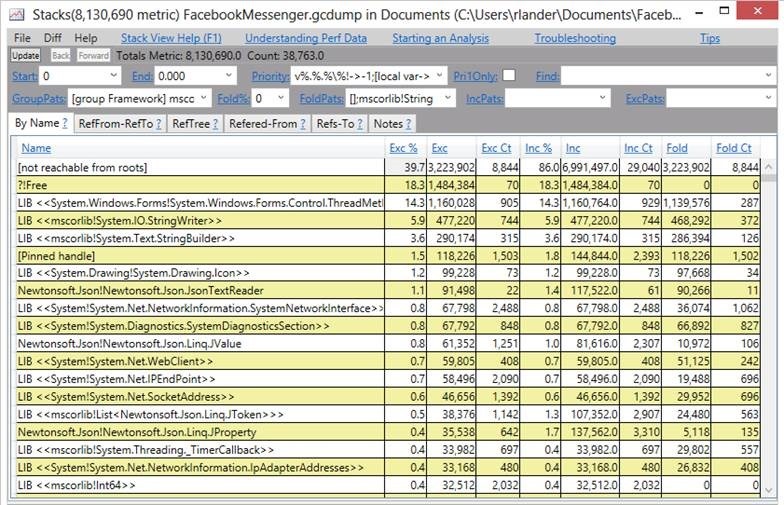
I collected a performance trace of the app using PerfView. The following screenshot shows us what PerfView saw, during 11s of sampling. PerfView samples the instruction pointer of each CPU every millisecond. As a result, we see a very representative sample of the app’s execution. Slow code will definitely show up. Conversely, fast code is so fast that it doesn’t even show up (it was probably inlined into the button click handler), so it isn’t interesting to look at from the perspective of improving app performance.
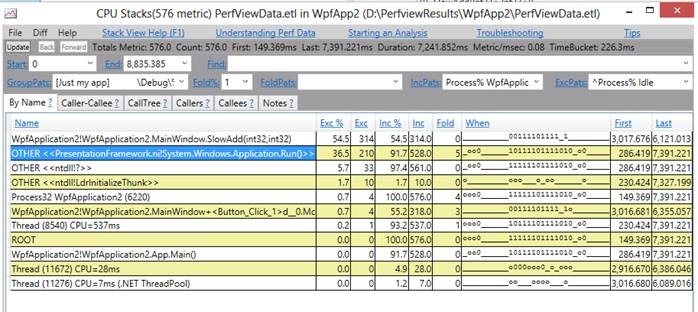
Not at all surprisingly, SlowAdd is the big offender in this app. Across 54.5% of samples, the app was in SlowAdd, so we can reasonably say that the app was in SlowAdd 54.5% of the time. That’s a lot of time. You may also notice that FastAdd doesn’t even show up. That’s fast code! FastAdd may have been inlined by the CLR JIT too, but that’s really just further evidence that it isn’t a performance bottleneck.
It might not be immediately obvious how to interpret the columns you see in the stack viewer. The four most important ones are labeled as Exc%, Exc, Inc%, and Inc. These represent the exclusive and inclusive time spent in a method, expressed as both percentages and in absolute numbers. Exc% and Exc represent the time spent exclusively in a given method. Inc% and Inc represent the exclusive time plus the time spent in the methods the given method calls (directly or indirectly). In this case, the inclusive time of Application.Run adds up to 91.7% of execution, because it indirectly calls SlowAdd.
PerfView exposes a lot of information in a compact format. You can click or hover over any of the hyperlinked parts of the app to get detailed help documentation.
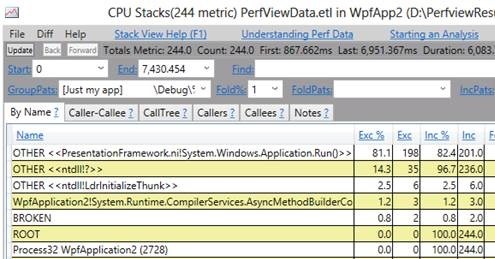
After reviewing the PerfView analysis, I replaced my call to SlowAdd with FastAdd. Let’s see what the result of the change is. You’ll quickly see that SlowAdd doesn’t even show up anymore. More importantly, you’ll notice that the absolute numbers in the PerfView stack viewer have dropped quite a lot. That’s a great resolution.
Investigation 2: Making PerfView faster
This may sound a bit confusing at first, but we can use PerfView to investigate and resolve performance issues in PerfView itself. After all, it’s just another app that can suffer from performance problems. One place where PerfView is slower than we’d like is when it’s updating the stack viewer window. If the traces being viewed are large, this can take many seconds. We want the update to be as fast as possible, so we used PerfView to see what could be done. I’ll quickly walk you through the investigation.
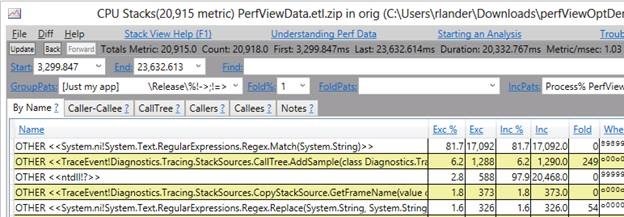
First, we collected a trace that included the time when we opened the CPU stacks view on a large event trace log (.etl) file. We then looked at this file in the CPU stack view and zoomed in to the time where the update of the stack viewer occurred (from 3.3 seconds to 23.6 seconds into the trace). Here’s what we saw:
Two things immediately jump out:
- We see that during this time (20.918 seconds), we used 20.915 seconds of CPU time. First of all, this is a lot of time (the user starts growing impatient after a few seconds). Also, on average, we were fully using one processor for the entire time. Therefore, we know that this is a CPU problem (not an I/O or network problem), and that any CPU time we save will result in saved end-to-end time.
- 81% of that time is spent in the Regex.Match method. If we could do that pattern matching more efficiently, we could save up to 17 seconds of that time! This is clearly what we need to focus on to improve this performance.
We have two choices to improve performance: call performance-sensitive routines such as Regex.Match less often, or do the matching more efficiently. As it turns out, most of the pattern matching that PerfView needs is very simple. Instead of using Regex.Match, we can use simple string operations (IndexOf and SubString) for more efficient pattern matching. This is the fix we implemented to resolve the performance issue.
Let’s take another look at PerfView, after the fix. The screen illustration below shows the entire trace end to end.

Already we can see very positive signs: Regex.Match is now nowhere to be seen, and the total CPU time used for the entire scenario is now only 7.9 seconds, much smaller than the 21 seconds PerfView used just to open the stack viewer. We also see that largest amounts of CPU time are now spent in igdump32 (this is GUI pixel-rendering code) and in the WPF GUI code (PresentationFramework).
We could say that we’re done, but as a performance engineer, I’d like to know exactly how much time this fix saved. We need to find the starting and stopping points of our scenario (where we clicked the Update button in the stack viewer), and we need to find this for both the before and after traces. Once we have this information, we can compare the two sets of data.
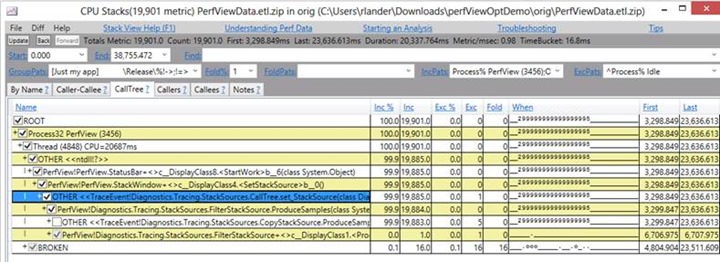
An easy way to find the starting and stopping points is to take advantage of the program structure. If we open the call tree view of the original (before) trace, we see:
PerfView shows that all this work was done as part of a call to the CallTree.set_StackSource method. This method is the main routine that runs when you click the Update button, so it would be a good guess to say that this routine starts when we push the button, and ends when PerfView updates the display. Thus, we can use CallTree.set_StackSource as a marker for the beginning and the end of our scenario. We see that our scenario starts at 3.298 seconds into the trace and ends at – seconds into the trace, for a delta of 20.337 seconds.
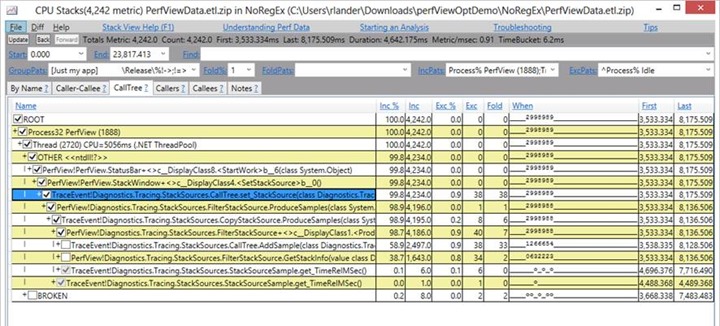
Now let’s find the same routine in the fixed (after) trace and review the changes.
You can see that the cost of CallTree.set_StackSource drops to 4.642 seconds. That’s a very large improvement that represents a 15.695 second or nearly 80% drop in time. I hope this example demonstrates how you can use PerfView to conduct and validate your own performance investigations.
Closing
PerfView enables you to identify the performance hotspots in your app and enables you to quickly determine the code that needs to be updated to mitigate the hotspots. You can use PerfView to investigate .NET Framework (all versions), C++, or JavaScript apps. It also supports investigating performance issues in Windows Store apps.
Please download PerfView and give it a try.
Follow or talk to us on twitter — https://twitter.com/dotnet.

0 comments