This is a guest blog from Giorgi Dalakishvili, the developer of EFCore.Visualizer.
Entity Framework Core is a powerful, feature-rich ORM powering many of today’s applications. With EF Core, developers write strongly-typed LINQ queries that the framework translates into SQL queries for the target database. With advanced features such as including nested collections and lazy loading, Entity Framework Core frees developers from writing boilerplate data access code.
The Problem
While LINQ queries are typically translated to well-performing SQL queries, as schemas become larger and queries more complex, the generated SQL can become suboptimal. Missing database indexes can also cause queries to execute slowly, leading to degraded application performance.
EF Core provides an easy way to log generated queries and identify slow queries. This might be enough sometimes but to really get to the root of the problem and see how the database engine executes queries, it’s necessary to explore the query execution plan.
The Solution
EFCore.Visualizer is a Visual Studio extension for viewing and analyzing query plans directly inside Visual Studio. The extension adds a debugger visualizer for IQueryable<> variables that shows both the generated query and its execution plan.
When you hit a breakpoint and hover over any IQueryable variable, EFCore.Visualizer captures the query, requests the execution plan from your database, and shows a visual representation of the query plan. The visualizer works with any EF Core query, whether it’s a simple Where clause or a complex query with joins, includes, and aggregations. The extension supports every major RDBMS: SQL Server, PostgreSQL, MySQL, SQLite, and Oracle, automatically detecting your database provider.
By bringing the query plan directly inside Visual Studio, it removes the need to switch between Visual Studio and the database management tool for viewing query plans and shortens the developer inner loop. Instead of copying the query from Visual Studio to database management tool, analyzing the execution plan, switching back, tweaking the query and repeating the above steps again, developers can view the query plan in Visual Studio right where they write and debug their code.
Installation
Getting started with EFCore.Visualizer is straightforward. You can install the extension directly from within Visual Studio by searching for “EFCore.Visualizer” in the Extension Manager. Alternatively, you can download it from the Visual Studio Marketplace.
Usage
To demonstrate the extension usage, I will use the following model:
public class BloggingContext : DbContext
{
    public DbSet<Blog> Blogs { get; set; }
    public DbSet<Post> Posts { get; set; }

    protected override void OnModelCreating(ModelBuilder modelBuilder)
    {
        base.OnModelCreating(modelBuilder);
        modelBuilder.Entity<Post>().HasIndex(p => p.PublishedAt);
    }
}

public class Blog
{
    public int BlogId { get; set; }
    public string Url { get; set; }

    public List<Post> Posts { get; } = new();
}

public class Post
{
    public int PostId { get; set; }
    public string Title { get; set; }
    public string Content { get; set; }

    public DateTimeOffset PublishedAt { get; set; }

    public int BlogId { get; set; }
    public Blog Blog { get; set; }
}
The sample database has a couple of thousand rows in the Posts table.
Once installed, start debugging and hover over any IQueryable instance. In the standard debugger tooltip click Query Plan Visualizer and view the generated SQL and the execution plan.
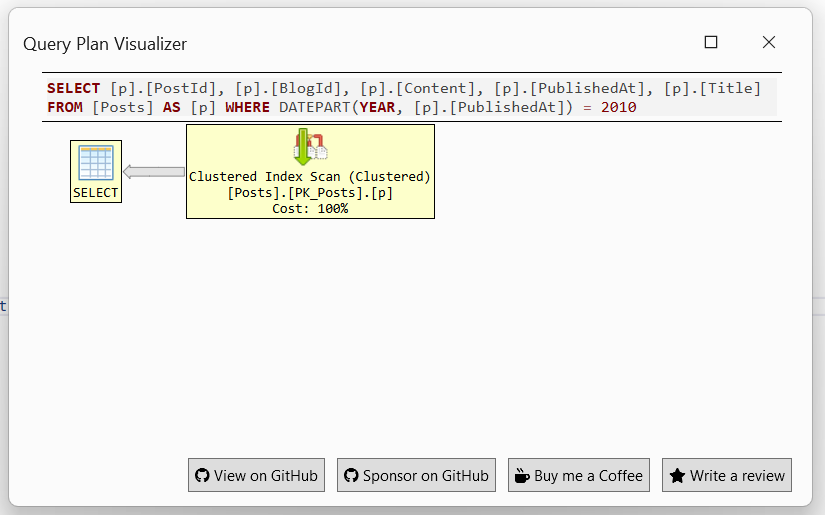
Let’s start by writing a query to get all posts written in 2010 and examining its execution plan:
var postsQuery = bloggingContext.Posts.Where(post => post.PublishedAt.Year == 2010);

You can see that even though there is an index on the PublishedAt column, SQL Server doesn’t use it. If you look at the generated query, you will notice that the query is extracting the year from PublishedAt the column, making the query non-sargable.
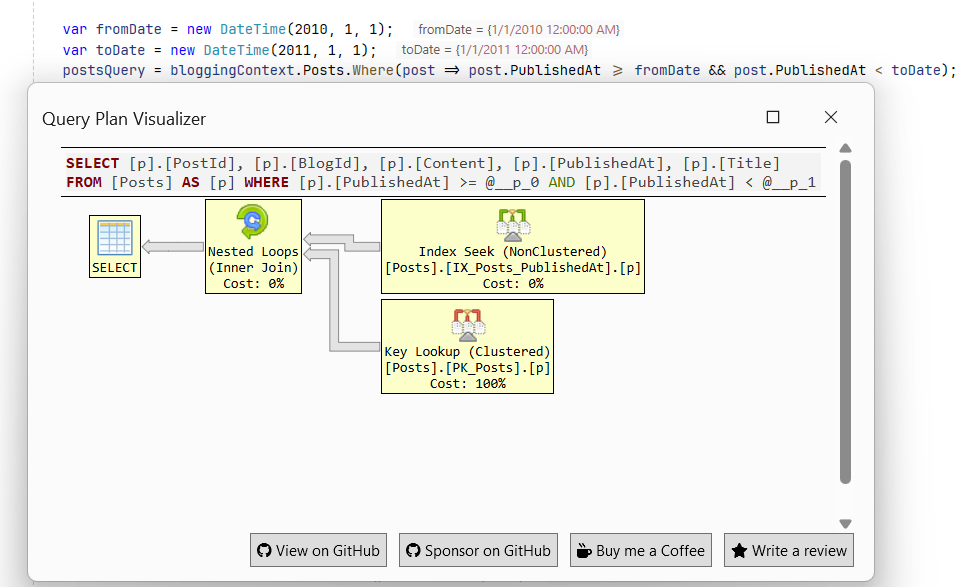
Let’s rewrite the query without changing the semantics and see what the execution plan looks like:
var fromDate = new DateTime(2010, 1, 1);
var toDate = new DateTime(2011, 1, 1);

postsQuery = bloggingContext.Posts.Where(post => post.PublishedAt >= fromDate && post.PublishedAt < toDate);
As you can see, with a simple change to the query, the database is now utilizing the index on the PublishedAt.
How it works
The visualizer works by turning the LINQ queries into ADO.NET commands and fetching its plan from the database engine. The plan is then rendered using the html-query-plan library for SQL Server, pev2 for Postgres, or treeflex for other databases.
Limitations
The visualizer doesn’t support queries when a reducing terminating operator is used (Count(), Min(), First() etc). Also, if the query is very complex or the network connection to the database engine is slow, fetching the query plan can exceed the 5-second limit for custom visualizers. Unfortunately, there is no way to extend the timeout, but you can vote for the issue.
Conclusion
As developers, we’ve all been there – staring at a slow query, wondering what the database is actually doing. If you’re working with Entity Framework Core and want to better understand your query performance, give EFCore.Visualizer a try. The source code is available on GitHub if you’d like to contribute or explore how it works.
For a deeper look at EFCore.Visualizer, check out its feature episode on Visual Studio Toolbox:


Ok Giorgi, this is of course super awesome. Efficient, Fast Linq to database queries incl. caching strategies is a blind spot for many .net developers I met during my career. What usually happens, is that too many queries run to query not needed column data or information that could be cached. Very often, queries fire somewhere in your code and you are unaware if you don't monitor closely. After reducing your number of queries to the minimum, and cache your master data, the long lasting queries can be optimized using the query plan. Running Sql Server Profiler in the background...
I wonder are we going to see this feature in Visual Studio Code as extension in future?