A new preview update of Blazor WebAssembly is now available! Here’s what’s new in this release:
- Debugging in Visual Studio and Visual Studio Code
- Auto-rebuild in Visual Studio
- Configuration
- New HttpClient extension methods for JSON handling
Get started
To get started with Blazor WebAssembly 3.2.0 Preview 3 install the latest .NET Core 3.1 SDK.
NOTE: Version 3.1.201 or later of the .NET Core SDK is required to use this Blazor WebAssembly release! Make sure you have the correct .NET Core SDK version by running
dotnet --versionfrom a command prompt.
Once you have the appropriate .NET Core SDK installed, run the following command to install the updated Blazor WebAssembly template:
dotnet new -i Microsoft.AspNetCore.Components.WebAssembly.Templates::3.2.0-preview3.20168.3
If you’re on Windows using Visual Studio, we recommend installing the latest preview of Visual Studio 2019 16.6. Installing Visual Studio 2019 16.6 Preview 2 or later will also install an updated version of the .NET Core 3.1 SDK that includes the Blazor WebAssembly template, so you don’t need to separately install it.
That’s it! You can find additional docs and samples on https://blazor.net.
Upgrade an existing project
To upgrade an existing Blazor WebAssembly app from 3.2.0 Preview 2 to 3.2.0 Preview 3:
- Update all Microsoft.AspNetCore.Components.WebAssembly.* package references to version 3.2.0-preview3.20168.3.
- Update all Microsoft.AspNetCore.Blazor.* package references to version 3.2.0-preview3.20168.3.
You’re all set – easy peasy!
Debugging
You can now debug Blazor WebAssembly apps directly from Visual Studio and Visual Studio Code. You can set breakpoints, inspect locals, and step through your code. You can also simultaneously debug your Blazor WebAssembly app and any .NET code running on the server. Using the browser dev tools to debug your Blazor WebAssembly apps is also still supported.
Enable debugging
To enable debugging in an existing Blazor WebAssembly app, update launchSettings.json in the startup project of your app to include the following inspectUri property in each launch profile:
"inspectUri": "{wsProtocol}://{url.hostname}:{url.port}/_framework/debug/ws-proxy?browser={browserInspectUri}"
This property enables the IDE to detect that this is a Blazor WebAssembly app and instructs the script debugging infrastructure to connect to the browser through Blazor’s debugging proxy.
Once updated, your launchSettings.json file should look something like this:
{
    "iisSettings": {
      "windowsAuthentication": false,
      "anonymousAuthentication": true,
      "iisExpress": {
        "applicationUrl": "http://localhost:50454",
        "sslPort": 44399
      }
    },
    "profiles": {
      "IIS Express": {
        "commandName": "IISExpress",
        "launchBrowser": true,
        "inspectUri": "{wsProtocol}://{url.hostname}:{url.port}/_framework/debug/ws-proxy?browser={browserInspectUri}",
        "environmentVariables": {
          "ASPNETCORE_ENVIRONMENT": "Development"
        }
      },
      "BlazorApp1.Server": {
        "commandName": "Project",
        "launchBrowser": true,
        "inspectUri": "{wsProtocol}://{url.hostname}:{url.port}/_framework/debug/ws-proxy?browser={browserInspectUri}",
        "applicationUrl": "https://localhost:5001;http://localhost:5000",
        "environmentVariables": {
          "ASPNETCORE_ENVIRONMENT": "Development"
        }
      }
    }
  }
Visual Studio
To debug a Blazor WebAssembly app in Visual Studio:
- Ensure you have installed the latest preview release of Visual Studio 2019 16.6 or later.
- Create a new ASP.NET Core hosted Blazor WebAssembly app.
- Hit F5 to run the app in the debugger.
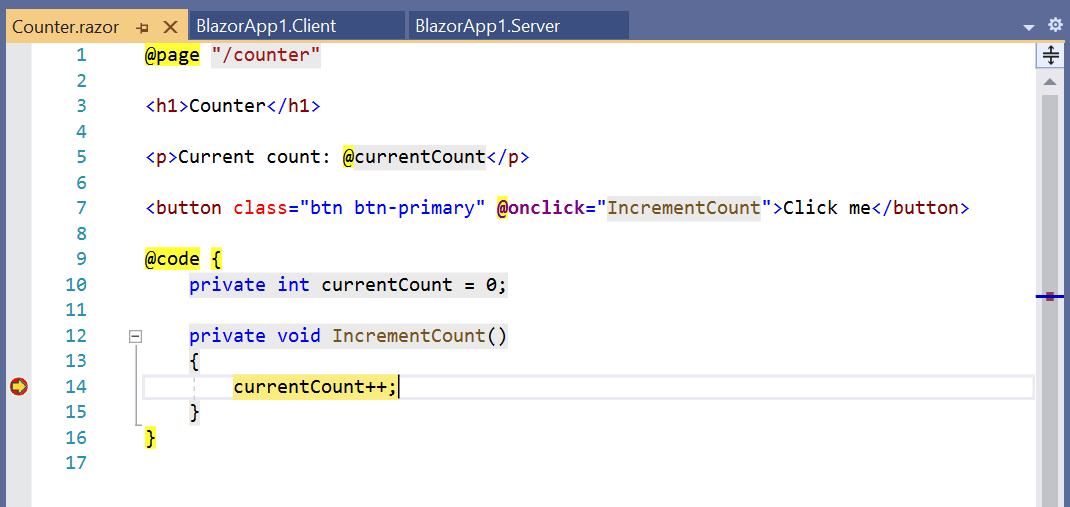
- Set a breakpoint in Counter.razor in the
IncrementCountmethod. - Browser to the Counter tab and click the button to hit the breakpoint:

- Check out the value of the
currentCountfield in the locals window:
- Hit F5 to continue execution.
While debugging your Blazor WebAssembly app you can also debug your server code:
- Set a breakpoint in the FetchData.razor page in
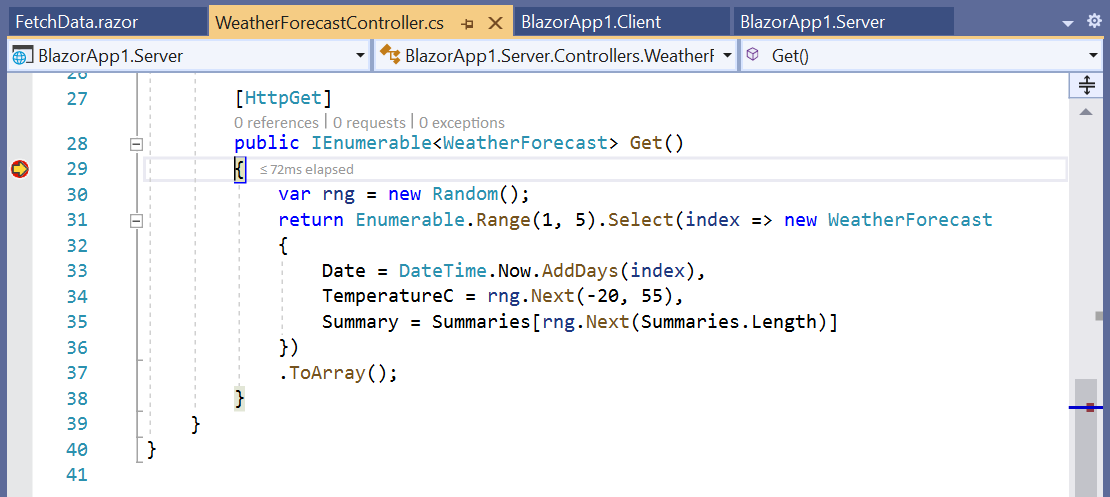
OnInitializedAsync. - Set a breakpoint in the
WeatherForecastControllerin theGetaction method. - Browser to the Fetch Data tab to hit the first breakpoint in the
FetchDatacomponent just before it issues an HTTP request to the server:
- Hit F5 to continue execution and then hit the breakpoint on the server in the
WeatherForecastController:
- Hit F5 again to let execution continue and see the weather forecast table rendered.
Visual Studio Code
To debug a Blazor WebAssembly app in Visual Studio Code:
- Install the C# extension and the JavaScript Debugger (Nightly) extension with the
debug.javascript.usePreviewsetting set totrue.

- Open an existing Blazor WebAssembly app with debugging enabled.
a. If you get the following notification that additional setup is required to enable debugging, recheck that you have the correct extensions installed and JavaScript preview debugging enabled and then reload the window:

b. A notification should offer to add required assets for building and debugging to the app. Select “Yes”.

- Starting the app in the debugger is then a two-step process:
a. Start the app first using the “.NET Core Launch (Blazor Standalone)” launch configuration.
b. Then start the browser using the “.NET Core Debug Blazor Web Assembly in Chrome” launch configuration (requires Chrome). To use the latest stable release of Edge instead of Chrome, change the
typeof the launch configuration in .vscode/launch.json frompwa-chrometopwa-msedge. - Set a breakpoint in the
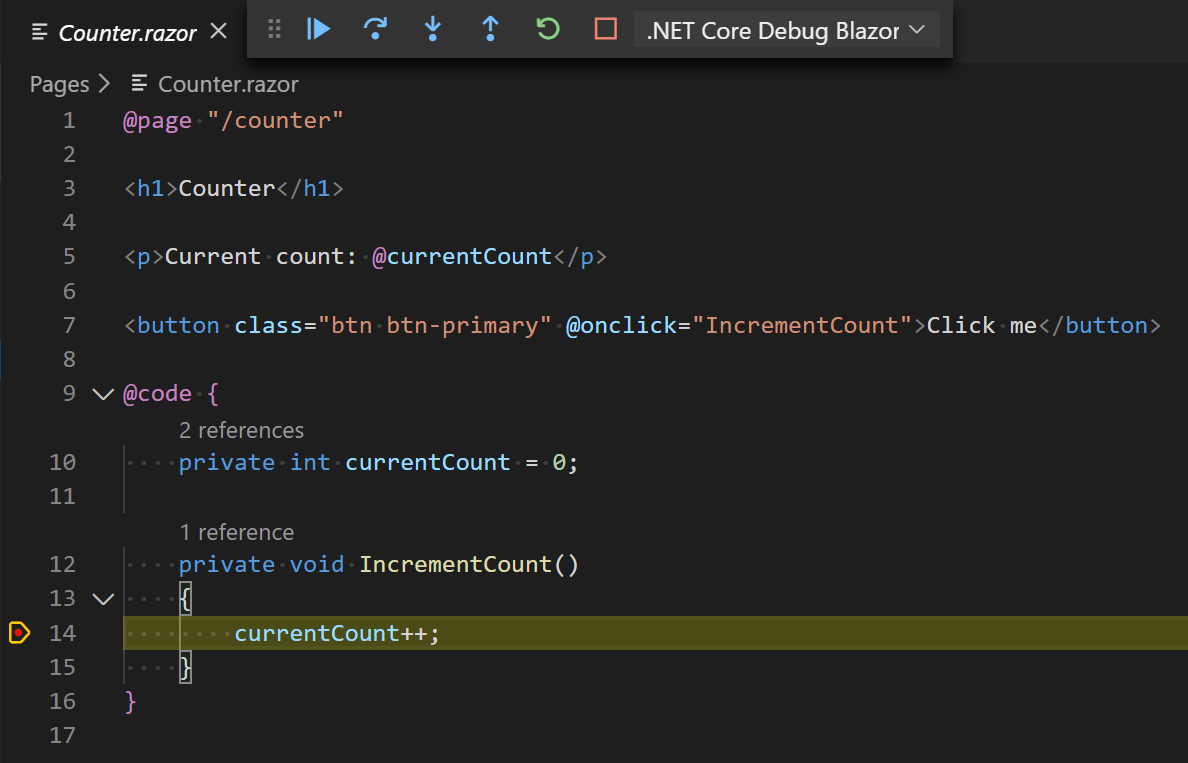
IncrementCountmethod in theCountercomponent and then select the button to hit the breakpoint:
Known limitations
There are a number of limitations with the current debugging experience in Visual Studio and Visual Studio Code. The following debugging features are not yet fully implemented:
- Inspecting arrays
- Hovering to inspect members
- Step debugging into or out of managed code
- Full support for inspecting value types
- Breaking on unhandled exceptions
- Hitting breakpoints during app startup
- Debugging an app with a service worker
We expect to continue to improve the debugging experience in future releases. We appreciate your feedback to help us get the Blazor WebAssembly debugging experience right!
Auto-rebuild in Visual Studio
Visual Studio 2019 16.6 will watch for file changes in .cs and .razor files across the solution and automatically rebuild and restart the app so that the changes can be seen by simply refreshing the browser. This enables auto-rebuild support for ASP.NET Core hosted Blazor WebAssembly projects and Razor Class Libraries. Instead of manually rebuilding and restarting the app when making code changes, just edit, save, and then refresh the browser.
To use auto-rebuild, run the app using IIS Express and without the debugger attached (Ctrl-F5 instead of F5).
Auto-rebuild is not yet enabled for standalone Blazor WebAssembly projects. With standalone Blazor WebAssembly apps, you can instead edit files, rebuild the app, and then refresh the browser without restarting the web server.
Configuration
Blazor WebAssembly apps now have built-in support for loading configuration data from appsettings.json and environment specific configuration data from appsettings.{environment}.json.
To add configuration data to your Blazor WebAssembly app:
- Add an appsettings.json file in the wwwroot folder of your Blazor WebAssembly app:
{
    "message": "Hello from config!"
}
- Inject an
IConfigurationinstance into your components to access the configuration data.
@page "/"
@using Microsoft.Extensions.Configuration
@inject IConfiguration Configuration

<h1>Configuration example</h1>

<p>@Configuration["message"]</p>
- Run the app to see the configured message displayed on the home page.
- To optionally override this configuration with values specific to the Development environment, add an appsettings.Development.json to your wwwroot folder:
{
    "message": "Hello from Development config!"
}
- If you now run the app in Development, you’ll see the new message.
Note: Blazor WebAssembly apps load the configuration data by downloading the JSON files to the browser, so these configuration files must be publicly addressable. Do not store secrets in these configuration files, as they are public and can be viewed by anyone.
New HttpClient extension methods for JSON handling
The .NET team has been hard at work creating a full set of new extension methods for HttpClient that handle JSON serialization and deserialization using System.Text.Json. These extension methods are now available in preview with the System.Net.Http.Json package and they will replace the existing helper methods in the Microsoft.AspNetCore.Blazor.HttpClient package. We haven’t updated the Blazor WebAssembly template yet to use the new extension methods, but we will in our next Blazor WebAssembly preview update.
You can try the new extension methods yourself by replacing the Microsoft.AspNetCore.Blazor.HttpClient package with the newer System.Net.Http.Json package. Then add @using System.Net.Http.Json to your _Imports.razor file and update your code as follows:
| Microsoft.AspNetCore.Blazor.HttpClient | System.Net.Http.Json |
|---|---|
GetJsonAsync |
GetFromJsonAsync |
PostJsonAsync |
PostAsJsonAsync |
PutJsonAsync |
PutAsJsonAsync |
The updated implementation of the FetchData component in the default Blazor WebAssembly template looks like this:
@code {
    private WeatherForecast[] forecasts;

    protected override async Task OnInitializedAsync()
    {
        forecasts = await Http.GetFromJsonAsync<WeatherForecast[]>("WeatherForecast");
    }
}
System.Net.Http.Json also provides a JsonContent class that can be used for sending serialized JSON, as well as convenient helper methods for reading JSON from an HttpContent instance.
Look for more details on System.Net.Http.Json to be published soon on the .NET blog.
Known issues
There are a few known issues with this release that you may run into:
- When building a Blazor WebAssembly app using an older .NET Core SDK you may see the following build error:
error MSB4018: The "ResolveBlazorRuntimeDependencies" task failed unexpectedly.
error MSB4018: System.IO.FileNotFoundException: Could not load file or assembly '\BlazorApp1\obj\Debug\netstandard2.1\BlazorApp1.dll'. The system cannot find the file specified.
error MSB4018: File name: '\BlazorApp1\obj\Debug\netstandard2.1\BlazorApp1.dll'
error MSB4018:    at System.Reflection.AssemblyName.nGetFileInformation(String s)
error MSB4018:    at System.Reflection.AssemblyName.GetAssemblyName(String assemblyFile)
error MSB4018:    at Microsoft.AspNetCore.Components.WebAssembly.Build.ResolveBlazorRuntimeDependencies.GetAssemblyName(String assemblyPath)
error MSB4018:    at Microsoft.AspNetCore.Components.WebAssembly.Build.ResolveBlazorRuntimeDependencies.ResolveRuntimeDependenciesCore(String entryPoint, IEnumerable`1 applicationDependencies, IEnumerable`1 monoBclAssemblies)
error MSB4018:    at Microsoft.AspNetCore.Components.WebAssembly.Build.ResolveBlazorRuntimeDependencies.Execute()
error MSB4018:    at Microsoft.Build.BackEnd.TaskExecutionHost.Microsoft.Build.BackEnd.ITaskExecutionHost.Execute()
error MSB4018:    at Microsoft.Build.BackEnd.TaskBuilder.ExecuteInstantiatedTask(ITaskExecutionHost taskExecutionHost, TaskLoggingContext taskLoggingContext, TaskHost taskHost, ItemBucket bucket, TaskExecutionMode howToExecuteTask)
To address this issue, update to version 3.1.201 or later of the .NET Core 3.1 SDK.
- You may see the following warning when building from the command-line:
CSC : warning CS8034: Unable to load Analyzer assembly C:\Users\user\.nuget\packages\microsoft.aspnetcore.components.analyzers\3.1.0\analyzers\dotnet\cs\Microsoft.AspNetCore.Components.Analyzers.dll : Assembly with same name is already loadedTo address this issue, update to your package reference to
Microsoft.AspNetCore.Componentsto 3.1.3 or newer. If your project reference theMicrosoft.AspNetCore.Componentspackage through a transitive package reference that has not been updated, you can add a reference in your project to resolve the issue in your project. - The following error may occur when publishing an ASP.NET Core hosted Blazor app with the .NET IL linker disabled:
An assembly specified in the application dependencies manifest (BlazorApp1.Server.deps.json) was not foundThis error occurs when assemblies shared by the server and Blazor client project get removed during publish (see https://github.com/dotnet/aspnetcore/issues/19926).
To workaround this issue, ensure that you publish with the .NET IL linker enabled. To publish with the linker enabled:
- Publish using a Release build configuration:
dotnet publish -c Release. The .NET IL linker is automatically run for Release builds, but not for Debug builds. - Don’t set
BlazorWebAssemblyEnableLinkingtofalsein your client project file.
If you’re hitting issues running with the linker disabled, you may need to configure the linker to preserve code that is being called using reflection. See https://docs.microsoft.com/aspnet/core/host-and-deploy/blazor/configure-linker for details.
- Publish using a Release build configuration:
Feedback
We hope you enjoy the new features in this preview release of Blazor WebAssembly! Please let us know what you think by filing issues on GitHub.
Thanks for trying out Blazor!

146 comments