This guest post was written by Mike Rousos
ASP.NET Core supports diagnostic logging through the Microsoft.Extensions.Logging package. This logging solution (which is used throughout ASP.NET Core, including internally by the Kestrel host) is highly extensible. There’s already documentation available to help developers get started with ASP.NET Core logging, so I’d like to use this post to highlight how custom log providers (like Microsoft.Extensions.Logging.AzureAppServices and Serilog) make it easy to log to a wide variety of destinations.
It’s also worth mentioning that nothing in Microsoft.Extensions.Logging requires ASP.NET Core, so these same logging solutions can work in any .NET Standard environment.
A Quick Overview
Setting up logging in an ASP.NET Core app doesn’t require much code. ASP.NET Core new project templates already setup some basic logging providers with this code in the Startup.Configure method:
loggerFactory.AddConsole(Configuration.GetSection("Logging"));
loggerFactory.AddDebug();
These methods register logging providers on an instance of the ILoggerFactory interface which is provided to the Startup.Configure method via dependency injection. The AddConsole and AddDebug methods are just extension methods which wrap calls to ILoggerFactory.AddProvider.
Once these providers are registered, the application can log to them using an ILogger<T> (retrieved, again, via dependency injection). The generic parameter in ILogger<T> will be used as the logger’s category. By convention, ASP.NET Core apps use the class name of the code logging an event as the event’s category. This makes it easy to know where events came from when reviewing them later.
It’s also possible to retrieve an ILoggerFactory and use the CreateLogger method to generate an ILogger with a custom category.
ILogger‘s log APIs send diagnostic messages to the logging providers you have registered.
Structured Logging
One useful characteristic of ILogger logging APIs (LogInformation, LogWarning, etc.) is that they take both a message string and an object[] of arguments to be formatted into the message. This is useful because, in addition to passing the formatted message to logging providers, the individual arguments are also made available so that logging providers can record them in a structured format. This makes it easy to query for events based on those arguments.
So, make sure to take advantage of the args parameter when logging messages with an ILogger. Instead of calling
Logger.LogInformation("Retrieved " + records.Count + " records for user " + user.Id)
Consider calling
Logger.LogInformation("Retrieved {recordsCount} records for user {user}", records.Count, user.Id)
so that later you can easily query to see how many records are returned on average, or query only for events relating to a particular user or with more than a specific number of records.
Azure App Service Logging
If you will be deploying your ASP.NET Core app as an Azure app service web app or API, make sure to try out the Microsoft.Extensions.Logging.AzureAppServices logging provider.
Like other logging providers, the Azure app service provider can be registered on an ILoggerFactory instance:
loggerFactory.AddAzureWebAppDiagnostics(
  new AzureAppServicesDiagnosticsSettings
  {
    OutputTemplate = "{Timestamp:yyyy-MM-dd HH:mm:ss zzz} [{Level}] {RequestId}-{SourceContext}: {Message}{NewLine}{Exception}"
  }
);
The AzureAppServicesDiagnosticsSettings argument is optional, but allows you to specify the format of logged messages (as shown in the sample, above), or customize how Azure will store diagnostic messages.
Notice that the output format string can include common Microsoft.Extensions.Logging parameters (like Level and Message) or ASP.NET Core-specific scopes like RequestId and SourceContext.
To log messages, application logging must be enabled for the Azure app service. Application logging can be enabled in the Azure portal under the app service’s ‘Diagnostic logs’ page. Logging can be sent either to the file system or blob storage. Blob storage is a better option for longer-term diagnostic storage, but logging to the file system allows logs to be streamed. Note that file system application logging should only be turned on temporarily, as needed. The setting will automatically turn itself back off after 12 hours.

Logging can also be enabled with the Azure CLI:
az appservice web log config --application-logging true --level information -n [Web App Name] -g [Resource Group]
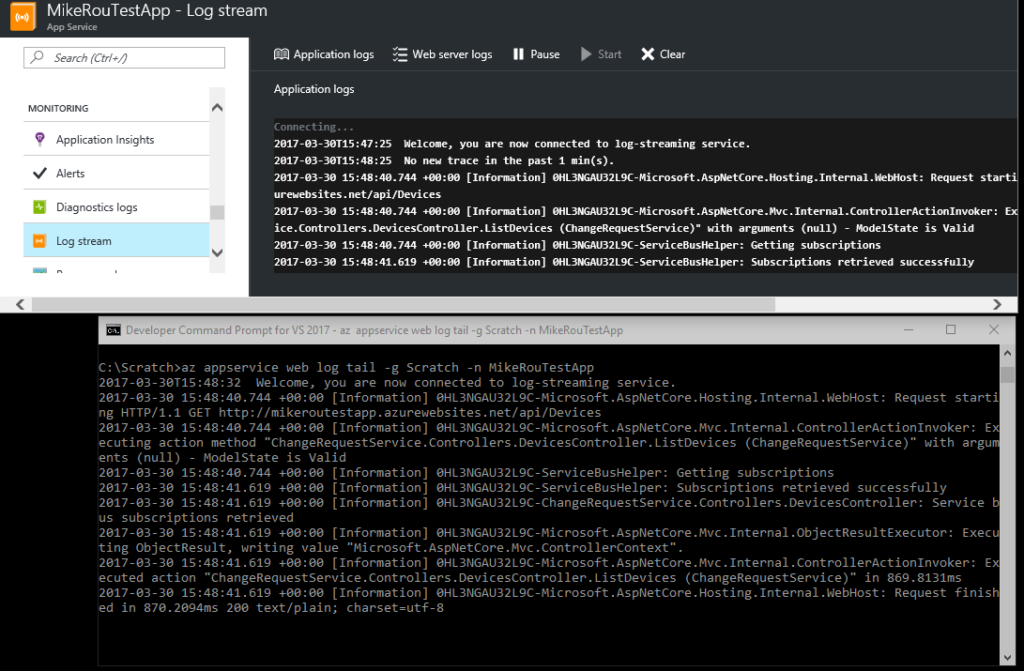
Once logging has been enabled, the Azure app service logging provider will automatically begin recording messages. Logs can be downloaded via FTP (see information in the diagnostics log pane in the Azure portal) or streamed live to a console. This can be done either through the Azure portal or with the Azure CLI. Notice the streamed messages use the output format specified in the code snippet above.
The Azure app service logging provider is one example of a useful logging extension available for ASP.NET Core. Of course, if your app is not run as an Azure app service (perhaps it’s run as a microservice in Azure Container Service, for example), you will need other logging providers. Fortunately, ASP.NET Core has many to choose from.
Serilog
ASP.NET Core logging documentation lists the many built-in providers available. In addition to the providers already seen (console, debug, and Azure app service), these include useful providers for writing to ETW, the Windows EventLog, or .NET trace sources.
There are also many third-party providers available. One of these is the Serilog provider. Serilog is a notable logging technology both because it is a structured logging solution and because of the wide variety of custom sinks it supports. Most Serilog sinks now support .NET Standard.
I’ve recently worked with customers interested in logging diagnostic information to custom data stores like Azure Table Storage, Application Insights, Amazon CloudWatch, or Elasticsearch. One approach might be to just use the default console logger or another built-in provider and capture the events from those output streams and redirect them. The problem with that approach is that it’s not suitable for production environments since the console log provider is slow and redirecting from other destinations involves unnecessary extra work. It would be much better to log batches of messages to the desired data store directly.
Fortunately, Serilog sinks exist for all of these data stores that do exactly that. Let’s take a quick look at how to set those up.
First, we need to reference the Serilog.Extensions.Logging package. Then, register the Serilog provider in Startup.Configure:
loggerFactory.AddSerilog();
AddSerilog registers a Serilog ILogger to receive logging events. There are two different overloads of AddSerilog that you may call depending on how you want to provide an ILogger. If no parameters are passed, then the global Log.Logger Serilog instance will be registered to receive events. Alternatively, if you wish to provide the ILogger via dependency injection, you can use the AddSerilog overload which takes an ILogger as a parameter. Regardless of which AddSerilog overload you choose, you’ll need to make sure that your ILogger is setup (typically in the Startup.ConfigureServices method).
To create an ILogger, you will first create a new LoggerConfiguration object, then configure it (more on this below), and call LoggerConfiguration.CreateLogger(). If you will be registering the static Log.Logger, then just assign the logger you have created to that property. If, on the other hand, you will be retrieving an ILogger via dependency injection, then you can use services.AddSingleton<Serilog.ILogger> to register it.
Configuring Serilog Sinks
There are a few ways to configure Serilog sinks. One good approach is to use the LoggerConfiguration.ReadFrom.Configuration method which accepts an IConfiguration as an input parameter and reads sink information from the configuration. This IConfiguration is the same configuration interface that is used elsewhere for ASP.NET Core configuration, so your app’s Startup.cs probably already creates one.
The ability to configure Serilog from IConfiguration is contained in the Serilog.Settings.Configuration package. Make sure to add a reference to that package (as well as any packages containing sinks you intend to use).
The complete call to create an ILogger from configuration would look like this:
var logger = new LoggerConfiguration()
  .ReadFrom.Configuration(Configuration)
  .CreateLogger();

Log.Logger = logger;
// or: services.AddSingleton<Serilog.ILogger>(logger);
Then, in a configuration file (like appsettings.json), you can specify your desired Serilog configuration. Serilog expects to find a configuration element named ‘Serilog’. In that configuration property, you can specify a minimum event level to log and a ‘writeto’ element that is an array of sinks. Each sink needs a ‘name’ property to identify the kind of sink it is and, optionally, can take an args object to configure the sink.
As an example, here is an appsettings.json file that sets the minimum logging level to ‘Information’ and adds two sinks – one for Elasticsearch and one for LiterateConsole (a nifty color-coded structured logging sink that writes to the console):
Another option for configuring Serilog sinks is to add them programmatically when creating the ILogger. For example, here is an updated version of our previous ILogger creation logic which loads Serilog settings from configuration and adds additional sinks programmatically using the WriteTo property:
var logger = new LoggerConfiguration()
  .ReadFrom.Configuration(Configuration)
  .WriteTo.AzureTableStorage(connectionString, LogEventLevel.Information)
  .WriteTo.AmazonCloudWatch(new CloudWatchSinkOptions
    {
      LogGroupName = "MyLogGroupName",
      MinimumLogEventLevel = LogEventLevel.Warning
    }, new AmazonCloudWatchLogsClient(new InstanceProfileAWSCredentials(), RegionEndpoint.APNortheast1))
  .CreateLogger();
In this example, we’re using Azure credentials from a connection string and AWS credentials from the current instance profile (assuming that this code will run on an EC2 instance). We could just as easily use a different AWSCredentials class if we wanted to load credentials in some other way.
Once Serilog is setup and registered with your application’s ILoggerFactory, you will start seeing events (both those you log with an ILogger and those internally logged by Kestrel) in all appropriate sinks!
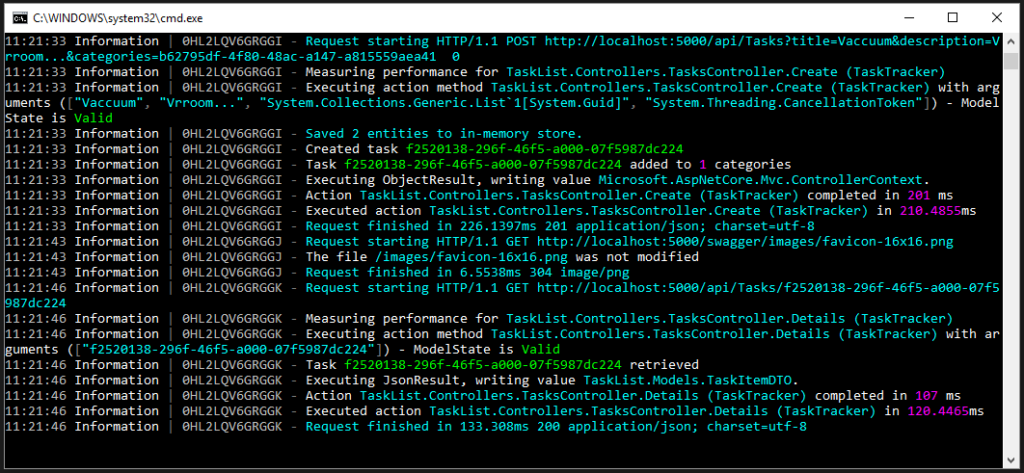
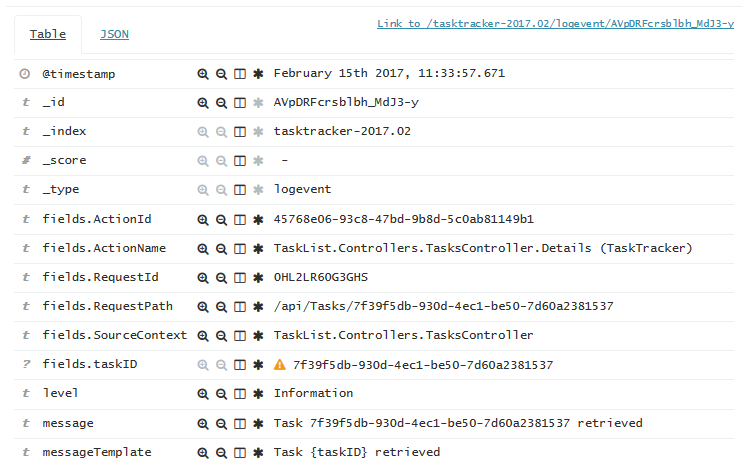
Here is a screenshot of events logged by the LiterateConsole sink and a screenshot of an Elasticsearch event viewed in Kibana:
Notice in the Elasticsearch event, there are a number of fields available besides the message. Some (like taskID), I defined through my message format string. Others (like RequestPath or RequestId) are automatically included by ASP.NET Core. This is the power of structured logging – in addition to searching just on the message, I can also query based on these fields. The Azure table storage sink preserves these additional data points as well in a json blob in its ‘data’ column:
Conclusion
Thanks to the Microsoft.Extensions.Logging package, ASP.NET Core apps can easily log to a wide variety of endpoints. Built-in logging providers cover many scenarios, and thid-party providers like Serilog add even more options. Hopefully this post has helped give an overview of the ASP.NET Core (and .NET Standard) logging ecosystem. Please check out the official docs and Serilog.Extensions.Logging readme for more information.


I have been trying Serilog in an Azure App Service, but when reading in from the site application settings, I cant seem to get the correct Key. Since it’s linux atm for .net core 3.1 I have been trying values like Serilog__WriteTo__0__Name and Serilog__WriteTo__0__Args__databaseUrl (for writing to MongoDb) – but each time I get errors around the configuration being passed in. Any idea what I did wrong?