Welcome Back! – The AJAX Control Toolkit March 2015 Update
Its been 15 months since a significant update was released for the AJAX Control Toolkit on CodePlex. In the time since then, our friends at DevExpress have stepped up and offered to lead this open source project. In just a few short months, they have implemented a number of modern and strategic changes to the toolkit to help make it a valuable part of your ASP.NET Web Forms arsenal. This release is branded as version 15.1 and is available NOW from http://devexpress.com/ms-act
DevExpress has written a great post highlighting the updates they’ve made to the toolkit on their blog at community.devexpress.com In this post, I’m going to show you how to use the updated control toolkit to build a responsive movie ratings page with a simple bar graph.
Your Toolbox is Ready and Waiting
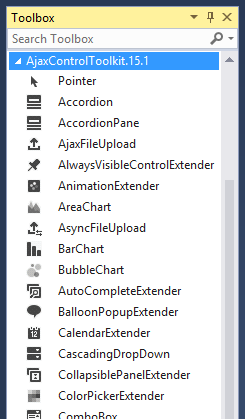
When you start a new web project with the controls installed, you will find your toolbox in ASPX pages loaded with the controls in a new AJAX Control Toolkit 15.1 section:
On a new webform, get started by adding a standard asp:ScriptManager and the references to start using the bootstrap framework:
<head runat="server"> <title></title> <link href="Content/bootstrap.css" rel="stylesheet" /></head> <body> <form id="form1" runat="server"> <asp:ScriptManager runat="server"></asp:ScriptManager> <h2>My Movies</h2></form>
<script src="Scripts/jquery-1.10.2.js"></script> <script src="Scripts/bootstrap.js"></script></body> Add a GridView with a Rating Control
Next, I’m going to add a GridView to the page, but I also want it to have a responsive behavior. It should size appropriately for the browser window it is presented in:
<div class="row"> <div class="col-md-6"> <asp:GridView runat="server" ID="grid" CssClass="table" UseAccessibleHeader="true"> </asp:GridView> </div> <div class="col-md-6"> <!-- Graph goes here --> </div> </div> The div declared with the row class will allow two columns to float next to each other. The first column will contain the GridView, and the second will contain the bar graph. These two controls are placed in identical divs with the bootstrap class “col-sm-6”. This class indicates that the column has a width appropriate for a medium device (like a tablet in portrait orientation) and each div is allocated to 6 of 12 ‘virtual columns’ wide.
The GridView is assigned the CssClass ‘table’ to ensure that it behaves responsively within the bootstrap framework. Combined with the UseAccessibleHeader attribute, the content that is output by the GridView control will look and feel responsive with an appropriately decorated header row.
I’ll use model binding features to bind my grid to a collection of Movie objects in a method called grid_GetData:
<asp:GridView runat="server" ID="grid" CssClass="table" UseAccessibleHeader="true" ItemType="WebApplication11.Models.Movie" AutoGenerateColumns="false" SelectMethod="grid_GetData"> The rating control can be added in a TemplateField and use the bootstrap glyphicon classes to paint ratings stars in my table:
<asp:TemplateField HeaderText="Rating"> <ItemTemplate> <cc1:Rating ID="myRating" runat="server" Wrap="false" StarCssClass="glyphicon glyphicon-star-empty" FilledStarCssClass="glyphicon glyphicon-star" EmptyStarCssClass="glyphicon glyphicon-star-empty" WaitingStarCssClass="glyphicon glyphicon-star" MaxRating="5" CurrentRating="<%# Item.Rating %>" Tag="<%# Item.ID %>" OnChanged="myRating_Changed"> </cc1:Rating> </ItemTemplate> </asp:TemplateField> Adding a BarGraph
The bar graph is a simple control to add to this page, with a set of markup that needs to declare the size and title on the graph:
<cc1:BarChart runat="server" ID="bars" ChartHeight="250" ChartWidth="350" BorderStyle="None" ChartTitle="Highest Rated Movies"> </cc1:BarChart> Next, I wrote some C# in the code-behind to configure the data series and bind to this control:
private static readonly List<Models.Movie> _Movies = new List<Models.Movie>() { new Models.Movie {ID=1, Name="Iron Man", Rating=4}, new Models.Movie {ID=2, Name="Thor", Rating=3}, new Models.Movie {ID=3, Name="Captain America: The First Avenger"}, new Models.Movie {ID=4, Name="The Avengers", Rating=5}};
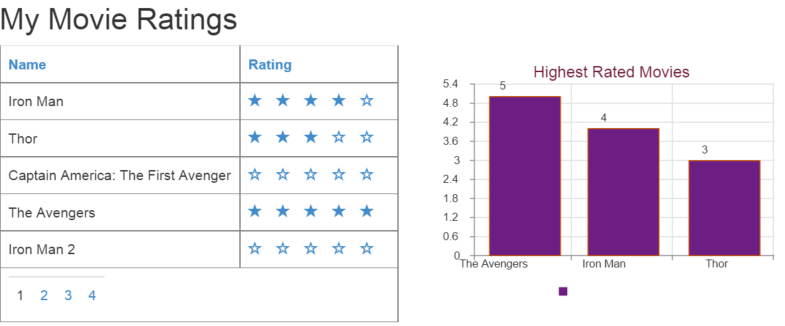
private void FormatChart() { var myData=_Movies.Where(m => m.Rating>0).OrderByDescending(m => m.Rating) .Select(m => new {x=m.Name, y=m.Rating}).Take(5); bars.Series.Add(new AjaxControlToolkit.BarChartSeries { Data = myData.Select(m => Convert.ToDecimal(m.y)).ToArray() }); bars.CategoriesAxis = string.Join(",", myData.Select(m => m.x).ToArray());} That’s all I needed to get started with a responsive grid and graph on a page with the updated AJAX Control Toolkit. The results look decent for writing no additional styling or images and using just the bootstrap framework:
Summary
DevExpress has more plans for the toolkit, and we’ll share them in the weeks ahead. Recharge your ASP.NET AJAX Control Toolkit by downloading the update from DevExpress now: http://devexpress.com/ms-act


0 comments