This post was written by Varun Venkatesan, Li Tian, Denis Pravdin, who are engineers at Intel. They are excited to share .NET Core-specific enhancements that Intel has made to VTune Amplifier 2019. You can use this tool to use to make .NET Core applications faster on Intel processors.
Update (2019.01.14): VTune™ Amplifier 2019 Update 2 is now available and includes support for Tiered Compilation on Windows and Linux. Tiered Compilation is expected to be turned on by default in future .NET Core releases. It can be turned on by setting the COMPlus_TieredCompilation environment variable from .NET Core 2.1 onwards. We recommend that .NET Core developers move to the latest version of VTune™ Amplifier for Tiered Compilation profiling to avoid seeing unresolved managed modules and functions in the profile.
Last year in the .NET blog, we discussed .NET Core Performance Profiling with Intel® VTune™ Amplifier 2018 including profiling Just-In-Time (JIT) compiled .NET Core code on Microsoft Windows* and Linux* operating systems. This year Intel VTune™ Amplifier 2019 was launched on September 12th, 2018 with improved source code analysis for .NET Core applications. It includes .NET Core support for profiling a remote Linux target and analyzing the results on a Windows host. We will walk you through a few scenarios to see how these new VTune Amplifier features can be used to optimize .NET Core applications.
Note that VTune Amplifier is a commercial product. In some cases, you may be eligible to obtain a free copy of VTune Amplifier under specific terms. To see if you qualify, please refer to https://software.intel.com/en-us/qualify-for-free-software and choose download options at https://software.intel.com/en-us/vtune/choose-download.
Background
Before this release, source code analysis on VTune Amplifier hotspots for JIT compiled .NET Core code was not supported on Linux and limited support on Windows. Hotspot functions were only available at the assembly-level and not at source-level, as shown in the figure below.
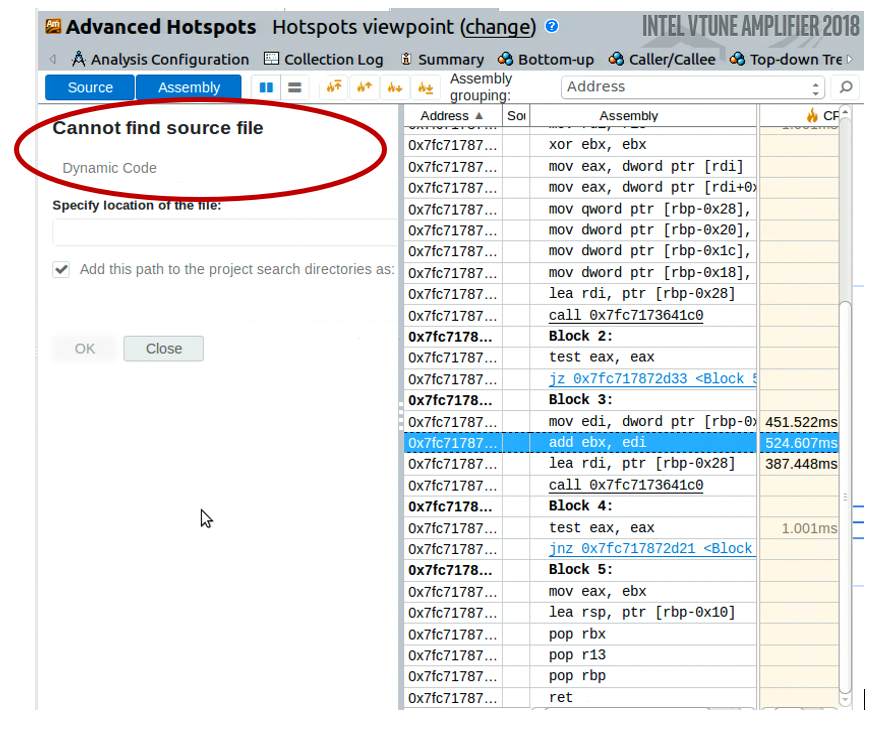
VTune Amplifier 2019 addresses this issue and provides full source code analysis for JIT compiled code on both Windows and Linux. It also supports remote profiling a Linux target from a Windows host. Let’s see how these features work using sample .NET Core applications on local Linux host, local Windows host and remote Linux profiling with Windows host analysis.
Here is the hardware/software configuration for the test system:
- Processor: Intel(R) Core(TM) i7-5960X CPU @ 3.00GHz
- Memory: 32 GB
- Ubuntu* 16.04 LTS (64-bit)
- Microsoft Windows 10 Pro Version 1803 (64-bit)
- .NET Core SDK 2.1.401
Profiling .NET Core applications on a local Linux host
Let’s create a sample .NET Core application on Linux that multiplies two matrices using the code available here. Following is the C# source code snippet of interest:
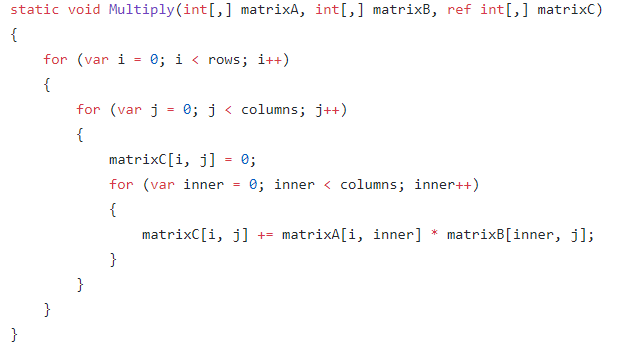
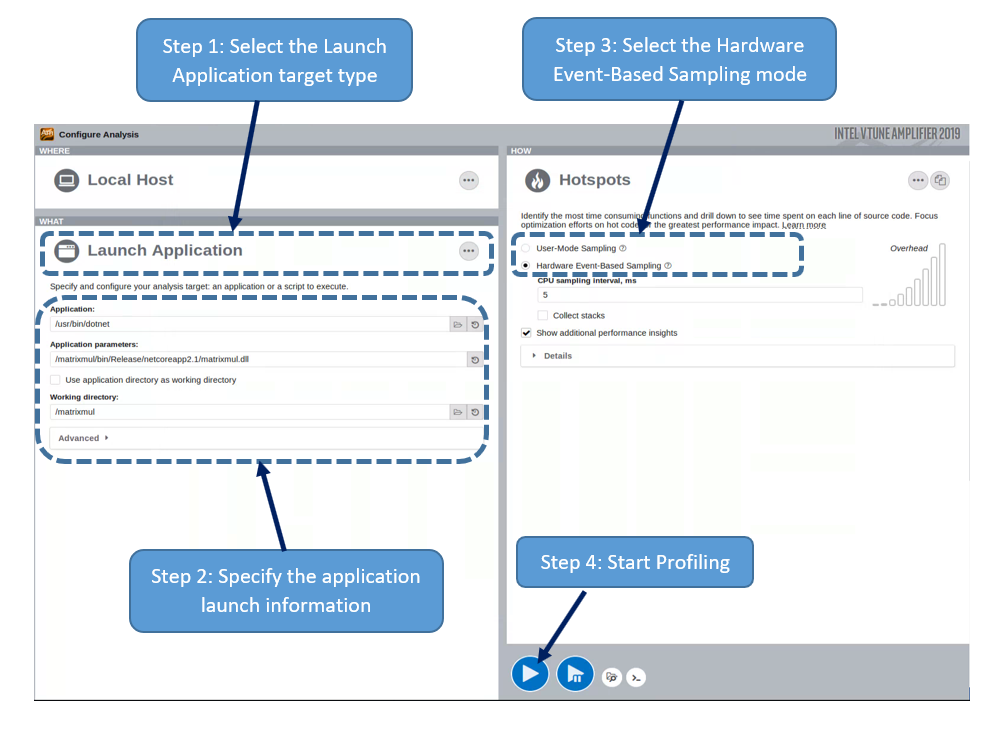
Now let’s refer to the instructions from our earlier .NET blog to build and run this application using the .NET Core command-line interface (CLI). Next let’s use VTune Amplifier to profile this application using the Launch Application target type and the Hardware Event-Based Sampling mode as detailed in the following picture.
Here are the hotspots under the Process/Module/Function/Thread/Call Stack grouping:

Now let’s take a look at the source-level hotspots for the Program::Multiply function, which is a major contributor to overall CPU time.

The above figure shows that most of the time is being spent in line 62 which performs matrix arithmetic operations. This source-assembly mapping helps both .NET Core application and compiler developers to identify their source-level hotspots and determine optimization opportunities.
Now, let’s use the new source code analysis feature to examine the assembly snippets corresponding to the highlighted source line.

From the above profile, it is clear that reducing the time spent in matrix arithmetic operations would help lower overall application time. One of the possible optimizations here would be to replace the rectangular array data structure used to represent individual matrices with jagged arrays. The C# source code snippet below shows how to do this (complete code is available here).

Here is the updated list of hotspot functions from VTune Amplifier:

We can see that the overall application time has reduced by about 21%1 (from 16.660 s to 13.175 s).
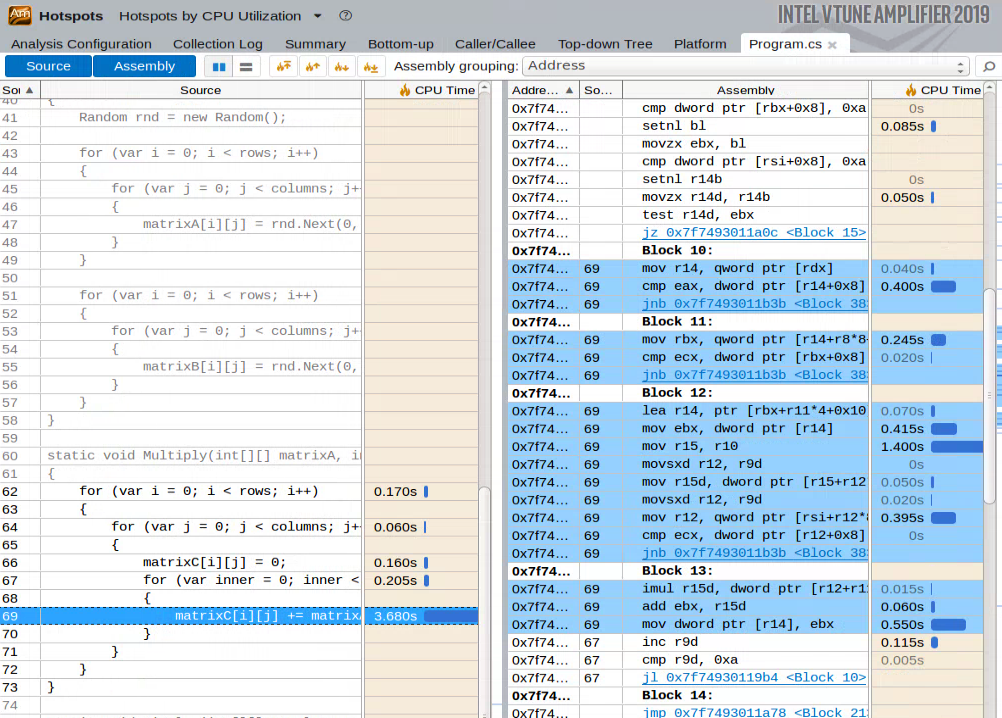
The following figure shows the source-assembly mapping for the Program::Multiply function. We see that there is a corresponding reduction in CPU time for the highlighted source line which performs matrix arithmetic operations. Note that the size of the JIT generated code has been reduced too.
This is a brief description about the feature on Linux. Similar analysis with the matrix multiplication samples above could be done on Windows and we leave that as an exercise for you to try. Now, let’s use a different example to see how source code analysis works on Windows.
Profiling .NET Core applications on a local Windows host
Let’s create a sample .NET Core application on Windows that reverses an integer array using the code available here. Following is the C# source code snippet of interest:
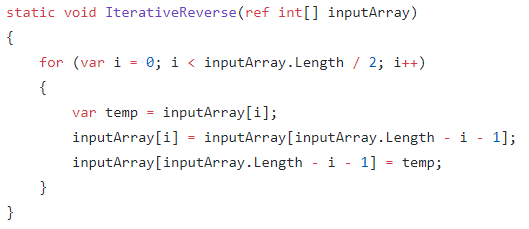
Now let’s refer to the instructions from our earlier .NET blog to build and run this application using the .NET Core command-line interface (CLI). Next let’s use VTune Amplifier to profile this application using the Launch Application target type and the Hardware Event-Based Sampling mode as detailed in the following picture. Additionally, we need to provide the source file location on Windows using the Search Sources/Binaries button before profiling.

Here are the hotspots under the Process/Module/Function/Thread/Call Stack grouping:

Now let’s take a look at the source-level hotspots for the Program::IterativeReverse function, which is a major contributor to overall CPU time.
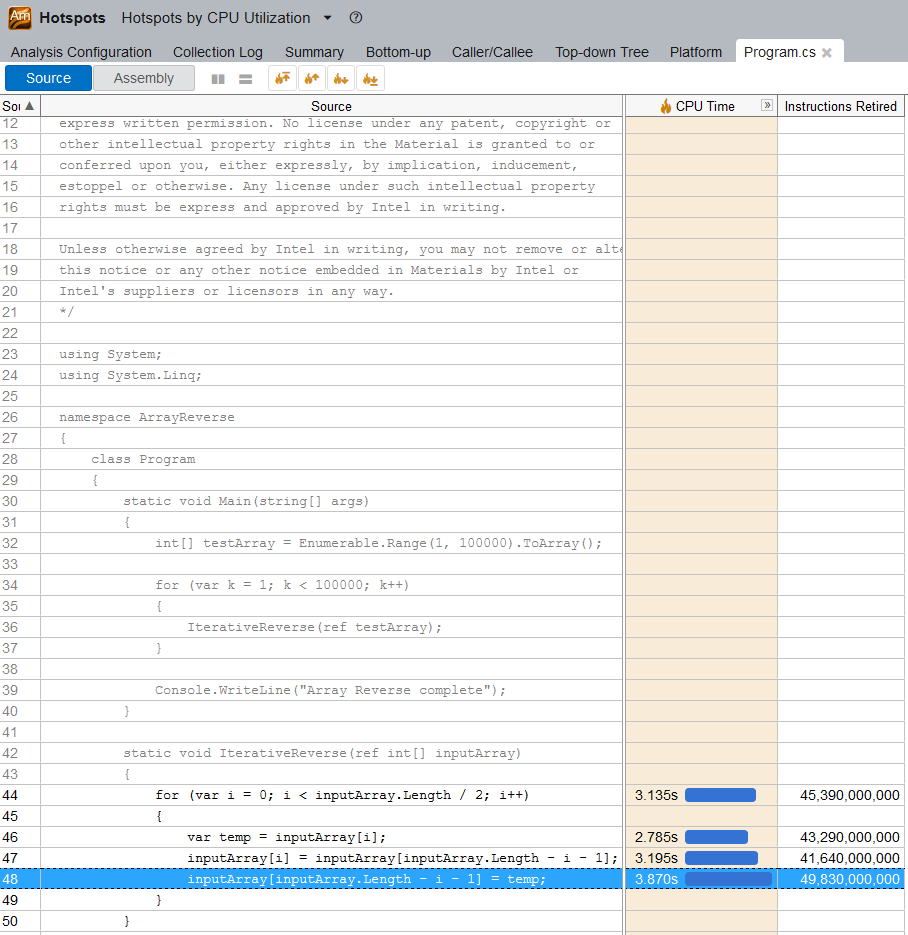
The above figure shows that most of the time is being spent in line 48 which performs array element re-assignment. Now, let’s use the new source code analysis feature to examine the assembly snippets corresponding to the highlighted source line.

One of the possible optimizations here would be to reverse the integer array by using recursion, rather than iterating over the array contents. The C# source code snippet below shows how to do this (complete code is available here).
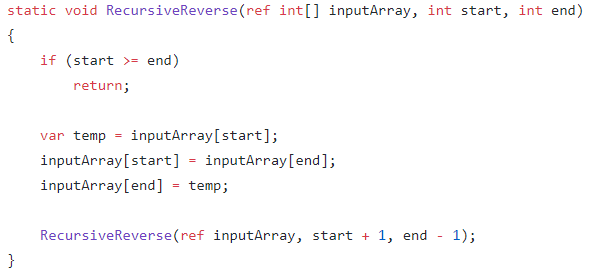
Here is the updated list of hotspot functions from VTune Amplifier:

We can see that the overall application time has reduced by about 42%2 (from 13.095 s to 7.600 s).
The following figure shows the source-assembly mapping for the Program::RecursiveReverse function.

As we can see, the reduction in time is reflected in the source lines above, giving developers a clear picture on how their application performs.
Profiling .NET Core applications on a remote Linux target and analyzing the results on a Windows host
Sometimes .NET Core developers may need to collect performance data on remote target systems and later finalize the data on a different machine in order to work around resource constraints on the target system or to reduce overhead when finalizing the collected data. VTune Amplifier 2019 has added .NET Core support to collect profiling data from a remote Linux target system and analyze the results on a Windows host system. This section illustrates how to leverage this capability using the matrix multiplication .NET Core application discussed earlier (source code is available here).
First let’s publish the sample application for an x64 target type on either the host or the target with: dotnet publish –c Release –r linux-x64. Then we need to copy the entire folder with sources and binaries to the other machine. Next let’s setup a password-less SSH access to the target with PuTTY, using instructions here. We also need to set /proc/sys/kernel/perf_event_paranoid and /proc/sys/kernel/kptr_restrict to 0 in the target system to enable driverless profiling so that user does not need to install target packages, while VTune Amplifier automatically installs the appropriate collectors on the target system.
echo 0 | sudo tee /proc/sys/kernel/perf_event_paranoid
echo 0 | sudo tee /proc/sys/kernel/kptr_restrict
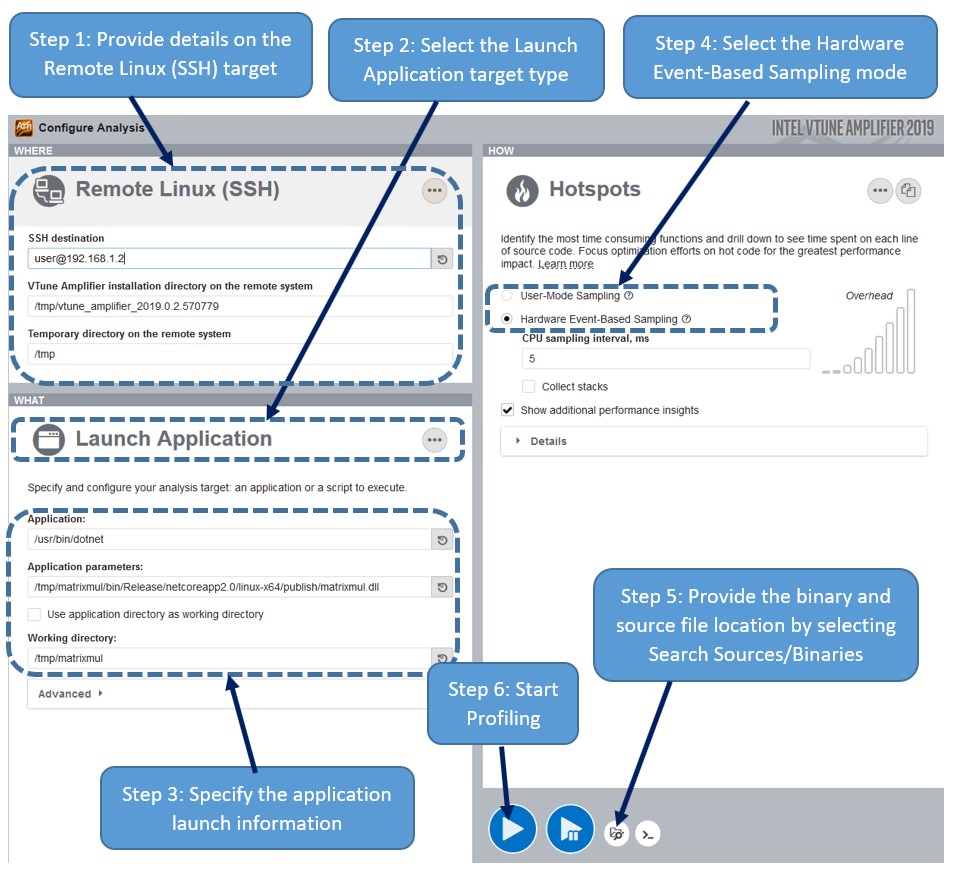
Now let’s use VTune Amplifier on the host machine to start remote profiling the application run on the target. First we need to set the profiling target to Remote Linux (SSH) and provide the necessary details to establish an SSH connection with the target. VTune Amplifier automatically installs the appropriate collectors on the target system in the /tmp/vtune_amplifier_<version>.<package_num> directory.

Then let’s select the Launch Application target type and the Hardware Event-Based Sampling modes. Additionally, we need to provide the binary and source file locations on Windows using the Search Sources/Binaries button before profiling.
Here are the hotspots under the Process/Module/Function/Thread/Call Stack grouping:
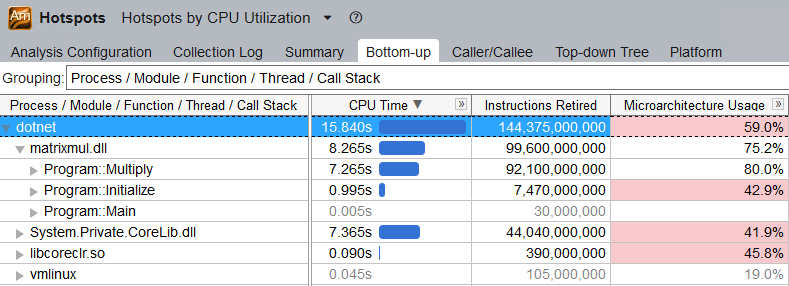
Let’s look at source code analysis in action by selecting one of the hotspot functions.
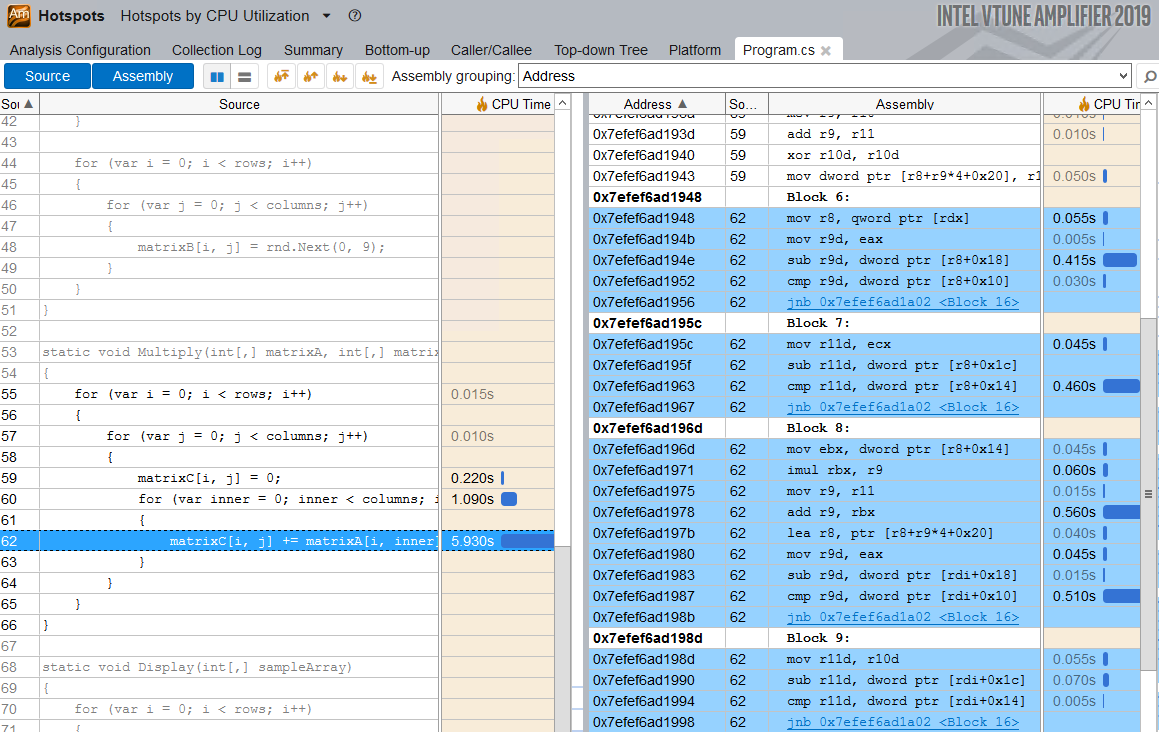
The support for remote profiling would enable developers collect low-overhead profiling data on resource-constrained target platforms and then analyze this information on the host.
Summary
The Source Code Analysis feature can be a useful value addition to the .NET Core community, especially for developers interested in performance optimization as they can get insights into hotspots at the source code and assembly levels and then work on targeted optimizations. We continue to look for additional .NET Core scenarios that could benefit from feature enhancements of VTune Amplifier. Let us know in the comments below if you have any suggestions in mind.
References
VTune Amplifier Product page: https://software.intel.com/en-us/intel-vtune-amplifier-xe
For more details on using the VTune Amplifier, see the product online help.
For more complete information about compiler optimizations, see our Optimization Notice.
No license (express or implied, by estoppel or otherwise) to any intellectual property rights is granted by this document.
Intel disclaims all express and implied warranties, including without limitation, the implied warranties of merchantability, fitness for a particular purpose, and non-infringement, as well as any warranty arising from course of performance, course of dealing, or usage in trade.
This document contains information on products, services and/or processes in development. All information provided here is subject to change without notice. Contact your Intel representative to obtain the latest forecast, schedule, specifications and roadmaps.
The products and services described may contain defects or errors known as errata which may cause deviations from published specifications. Current characterized errata are available on request.
Copies of documents which have an order number and are referenced in this document may be obtained by calling 1-800-548-4725 or by visiting www.intel.com/design/literature.htm.
Intel, the Intel logo, Intel Core, VTune are trademarks of Intel Corporation in the U.S. and/or other countries.
*Other names and brands may be claimed as the property of others
© Intel Corporation.

0 comments