
At this year’s GDC, we shared our vision for bringing console‑level GPU developer tools to Windows. As part of that announcement, we introduced DirectX Dump Files as a major step forward in GPU crash debugging on Windows.
Today, we’re excited to make our DirectX Dump Files public preview available to developers!
If you missed our GDC announcement, it’s now available in the GDC Vault: Bringing Console-Level GPU Tooling to Windows
You can also read our announcement blog: DirectX: Bringing Console‑Level Developer Tools to Windows
For instructions on how to get started today, see our Getting Started section
Help shape the future of DirectX Dump Files
We’re intentionally releasing DirectX Dump Files as a preview so we can hear developer feedback early and act on it. If you try it out, please tell us what’s working, what isn’t, and what you’d like to see next.
You can reach us via the DirectX Discord(#dxdmp), the Help->Send Feedback button in PIX, or by email at dxdmpsupport@microsoft.com.
A Unified Approach to GPU Crash Debugging
We have heard consistently from developers and partners that it’s been difficult to find and diagnose GPU crashes on PC. On top of being challenging to reproduce, the problem surface of different hardware, drivers, and Windows OS versions is vast, and there is no investigation process that works across all hardware vendors.
Today we’re taking a first step towards a robust cross-IHV solution with our DirectX Dump Files public preview.
DirectX Dump Files are the result of a yearslong effort. Delivering this new solution for GPU crashes required coordinated work across the DirectX runtime, drivers, the Windows graphics kernel and PIX. We are especially grateful to our hardware partners for their close collaboration!
Today, we’re taking the first step to give developers a scalable way to diagnose GPU crashes with actionable data captured directly at the point of failure. DirectX Dump Files record a snapshot of GPU execution at the moment of a crash, including hardware state, driver data, Direct3D runtime context and application data. This all gets packaged into a .dxdmp file that can be retrieved and analyzed by PIX and developers.
All four Windows IHVs (AMD, Intel, NVIDIA, Qualcomm) demoed DirectX Dump Files running on their hardware at GDC. We’ve been working closely with them to light up dedicated drivers for DirectX Dump Files. Today we already have driver support ready on selected devices and expect drivers that support an even wider range of hardware in the near future.
Even without dedicated drivers, partial DirectX Dump Files (which do not contain hardware state and driver data) will be generated on all hardware if a device has the requisite OS and Agility SDK support.
What does this preview mean?
This release marks the beginning of the DirectX Dump Files public preview. Our goal is to validate the end-to-end developer experience while continuing to expand hardware support and improve driver quality across the ecosystem. As this is the first preview release of DirectX Dump Files, there will be some rough edges, but please give us feedback if you hit any issues!
DirectX Dump Files are not yet intended for retail game deployment, and the corresponding Agility SDK requires Developer Mode to be enabled.
Hardware and driver coverage will improve over time as our hardware partners light up support. We’ll be sure to keep this blog post updated with the latest list of supported drivers and corresponding hardware.
We currently expect to ship retail support in Fall 2026 and encourage developers to use this preview to validate their workflows and help shape the final product.
Please send us feedback! You can reach us at the DirectX Discord(#pix), the Help->Send Feedback button in PIX, or by email at dxdmpsupport@microsoft.com
Contents
From Crash to Analysis
When a GPU crash occurs, DirectX Dump Files follow a well-defined flow from failure to investigation:
1. Windows detects the GPU crash through the TDR mechanism
When the GPU stops making forward progress, Windows detects the timeout via Timeout Detection and Recovery (TDR) and resets the device to recover the system
2. DirectX generates a .dxdmp file at the point of failure
At the moment of a TDR, the DirectX runtime captures a structured .dxdmp file that includes GPU execution state, driver-provided data, and Direct3D runtime state. Developers can also include up to 2MB of custom data along with metadata via new D3D12 APIs and callbacks
3. Developers retrieve the DirectX Dump File
Applications can register callbacks to receive the DirectX Dump File path at creation time, enabling integration with crash collection pipelines. The file is also retained locally in the preview build so that it is available for postmortem investigation immediately without modifying the application code
4. The DirectX Dump File can then be analyzed offline
The resulting .dxdmp file can then be opened in PIX. PIX, with support from IHV plugins, will try to expose several pieces of useful information by:
- Auto-detecting the cause of the GPU crash and point to the root cause
- Surfacing how the frame progressed before the crash and the shader instruction that may have caused it.
This model allows crashes to be analyzed after the fact without requiring reproduction on the original system and provides a consistent workflow across development and retail environments.
Developers can also use the PIX API to process a DirectX Dump File programmatically. For details about the PIX API itself, refer to the documentation located in your PIX installation directory.
For a detailed description of how dump files are generated and structured, see the specification: D3D12: DirectX Dump Files.
Getting Started
Step-by-Step Guide
1. Requirements
Confirm that you have the correct OS, Agility SDK, hardware, and driver support using the info supplied below
2. Set D3DConfig options (optional)
If the driver requires dump file options to be set before app launch, or if you’d like to set those options before app launch, D3DConfig can be used to set driver options (D3D12_DUMP_FILE_DRIVER_OPTIONS) and whether to retain dump files locally (enabled by default for preview).
3. Utilize PIX Markers (optional)
We recommend utilizing PIX markers and passing them to the graphics driver to maximize the usefulness of the resulting dump file, as PIX uses those to reconstruct frames and populate the event list, to help in crash investigation during postmortem debugging.
Check for feature support using D3D12_FEATURE_DATA_USER_DEFINED_ANNOTATION before enabling retail annotation mode, which is the mode required to enable the runtime to forward PIX markers to the graphics driver.
If supported, use the ID3D12DeviceTools2 interface to call SetUserDefinedAnnotationMode with argument D3D12_USER_DEFINED_ANNOTATION_MODE_DRIVER_RETAIL.
For more detailed information on PIX markers, refer to D3D12: PIX Markers | DirectX-Specs.
4. Determine feature support
Use CheckFeatureSupport with the new D3D12_FEATURE_DUMP_FILE struct.
This struct returns whether your OS supports DirectX Dump Files and what D3D12_DUMP_FILE_DRIVER_TIER and D3D12_DUMP_FILE_DRIVER_OPTIONS your driver supports.
5. Utilize runtime dump file functionality (optional)
Several dump file-related methods have been added to ID3D12DevicePreview:
| Method | Description |
| ConfigureDumpFile | Specify D3D12_DUMP_FILE_DRIVER_OPTIONS |
| SetDumpFileCallbacks | Hook-up dump file callbacks |
| AddBlobToDumpFile | Add custom data to dump files |
| RetainDumpFile | Keep the dump file locally |
| GetDeviceErrorCode | Retrieve device error code |
The dump file begin callback (D2D12_DUMPFILEBEGINCALLBACK) can be used to add application-side data via AddBlobToDumpFile.
The dump file end callback (D3D12_DUMPFILEENDCALLBACK) can be used to retrieve the dump file location.
6. Open dump file in PIX
To investigate the GPU crash, navigate to the dump file location and open it in PIX.
By default, the file is created at C:\Users\<UserName>\AppData\Local\CrashDumps\ and has this naming format: <NameOfExeWithoutExtension>-yyyy-mm-dd-hh-mm-ss.dxdmp_preview.
7. Analyze the dump file in using the PIX API (optional)
The PIX API can be used to analyze .dxdmp files programmatically. For more, please see the PIX API section
OS Support
OS support is required for generating .dxdmp files. As of the writing of this blog, support is in the latest versions of the following builds of Windows:
These builds can also be found in the Microsoft Update Catalog.
To get the latest version of Windows, go to Settings -> Windows Update and click “Check for Updates”.
Support for .dxdump will ship in all subsequent versions of Windows.
Agility SDK Support
Agility SDK 1.721.1-preview will have the necessary runtime pieces that will allow developers to use DirectX Dump Files.
Note that this Agility SDK requires machines to run with developer mode enabled. See here for more information on how to Enable Developer Mode.
Hardware and Driver Support
Support levels and available diagnostics will differ across hardware vendors and driver releases. Microsoft and our hardware partners will continue expanding support throughout the preview.
| IHV | Driver Link | Supported Hardware | Overheard Tier(s) – see below | PIX Marker Support |
| AMD | AMD Software: AgilitySDK Developer Preview Edition 26.10.07.02 | AMD Radeon™ RX 9000 Series Graphics
AMD Radeon™ RX 7000 Series Graphics |
HIGH_OVERHEAD | TRUE
See here for more details |
Intel: For more information, please contact your Intel Developer Technology representative.
NVIDIA: For in-development driver access, please contact your developer relations representative.
Qualcomm: For more information or preview driver access, please contact your Qualcomm Developer Relations representative.
Overhead Tiers
Developers will be able to toggle between performance overhead and capture fidelity. Drivers will have the following modes:
| Tier | Description |
| NO_OVERHEAD | Enables crash capture with no runtime cost and is suitable for broad deployment |
| MEDIUM_OVERHEAD | Provides a balance, capturing additional diagnostic data with moderate impact |
| HIGH_OVERHEAD | Collects the most detailed GPU and driver state available, enabling deeper investigation at the cost of higher runtime overhead |
For detailed information, refer to D3D12_DUMP_FILE_DRIVER_OPTIONS.
For more on which tiers are supported today, please see the Hardware and Driver Support section
PIX Support
PIX 2606.18-preview introduces support for DirectX DumpFiles, enabling developers to use PIX to open and investigate the state during a GPU crash. This information includes GPU execution data, driver-provided information, Direct3D runtime state, and application data.
Summary View
Provides a diagnosis of the cause of the debug error and links to other views that can provide more detailed diagnostic data. It also indicates if DRED features were enabled when the dxdmp file was generated via the DRED Info panel.
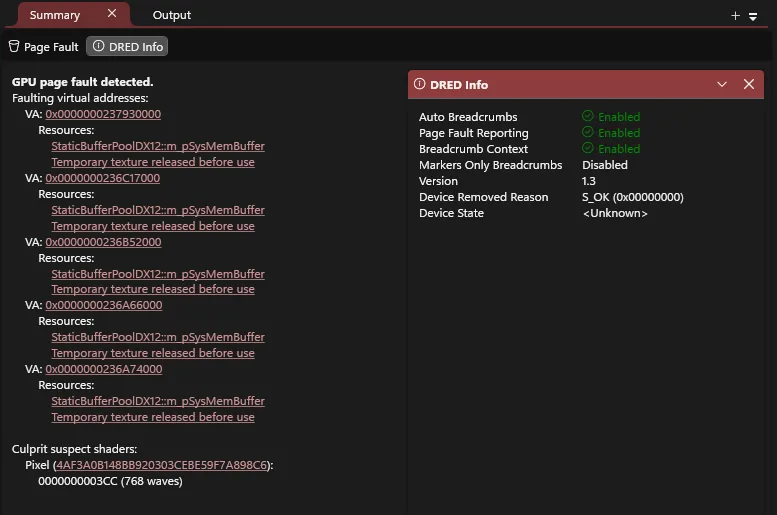
dxdmp file from adapter with driver support
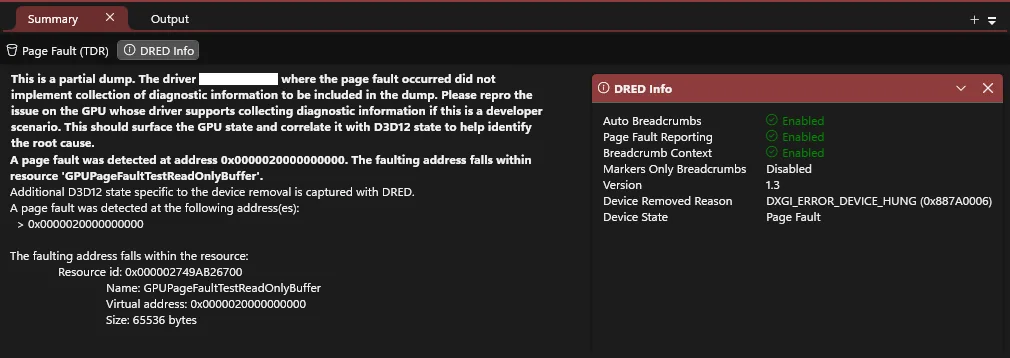
dxdmp file from adapter without driver support
Events View
Shows a hierarchical view of all D3D12 API calls, driver events, and PIX markers that were recorded into the dxdmp file, their execution status, and whether the events correspond to any executing shaders or recorded resources. If the DRED auto breadcrumbs feature was enabled, the breadcrumbs are also displayed here.
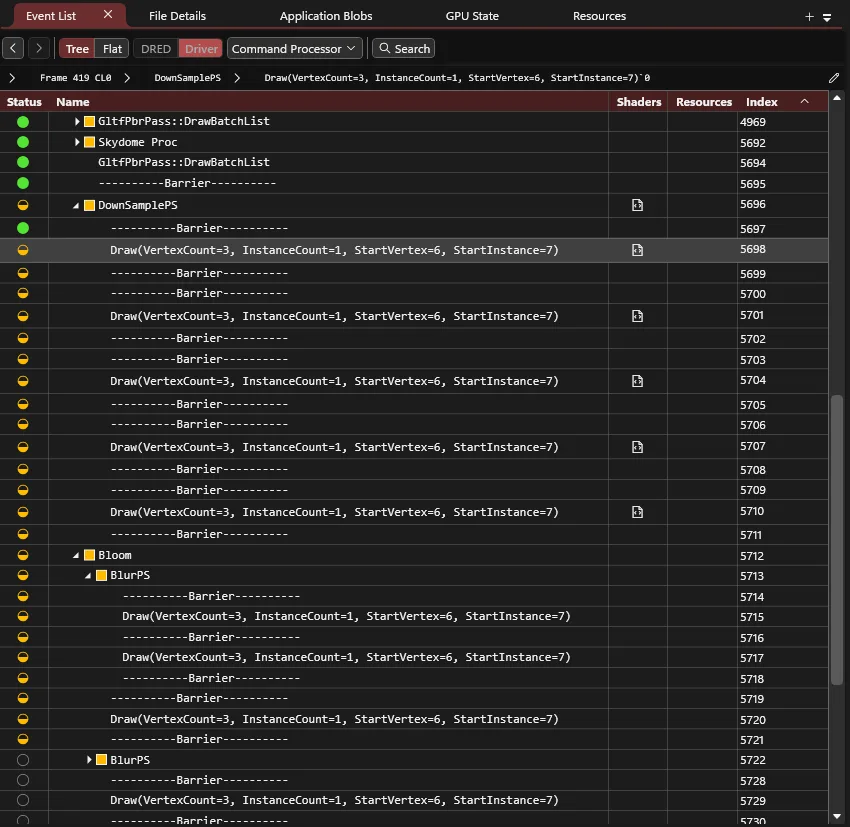
dxdmp file from adapter with driver support
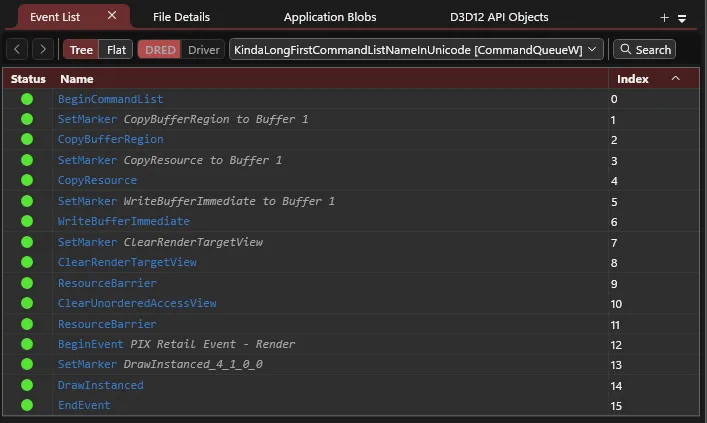
dxdmp file from adapter without driver support
Page Faults View
Shows all recorded faulting GPU virtual addresses and for each address, chronologically list all relevant resources recorded by the GPU driver with a virtual address range that encompasses the faulting address. If the DRED page fault reporting feature is enabled, this view will also list all active and recently freed allocations recorded by the D3D runtime.
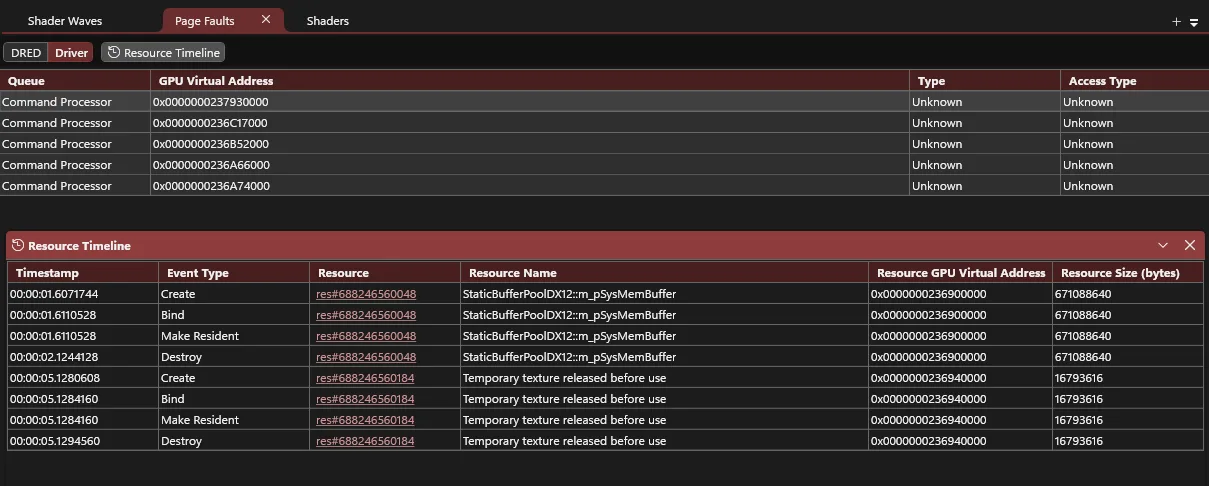
dxdmp file from adapter with driver support
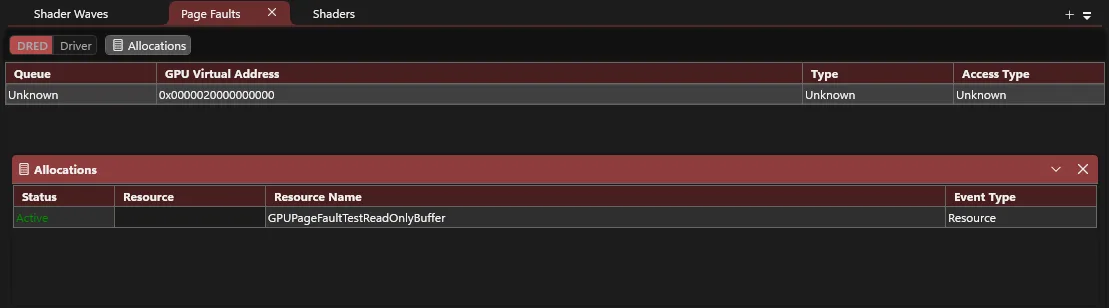
dxdmp file from adapter without driver support
Resources View
Lists all D3D12 resources recorded by the D3D runtime and GPU driver and chronologically lists all events recorded for a selected resource.
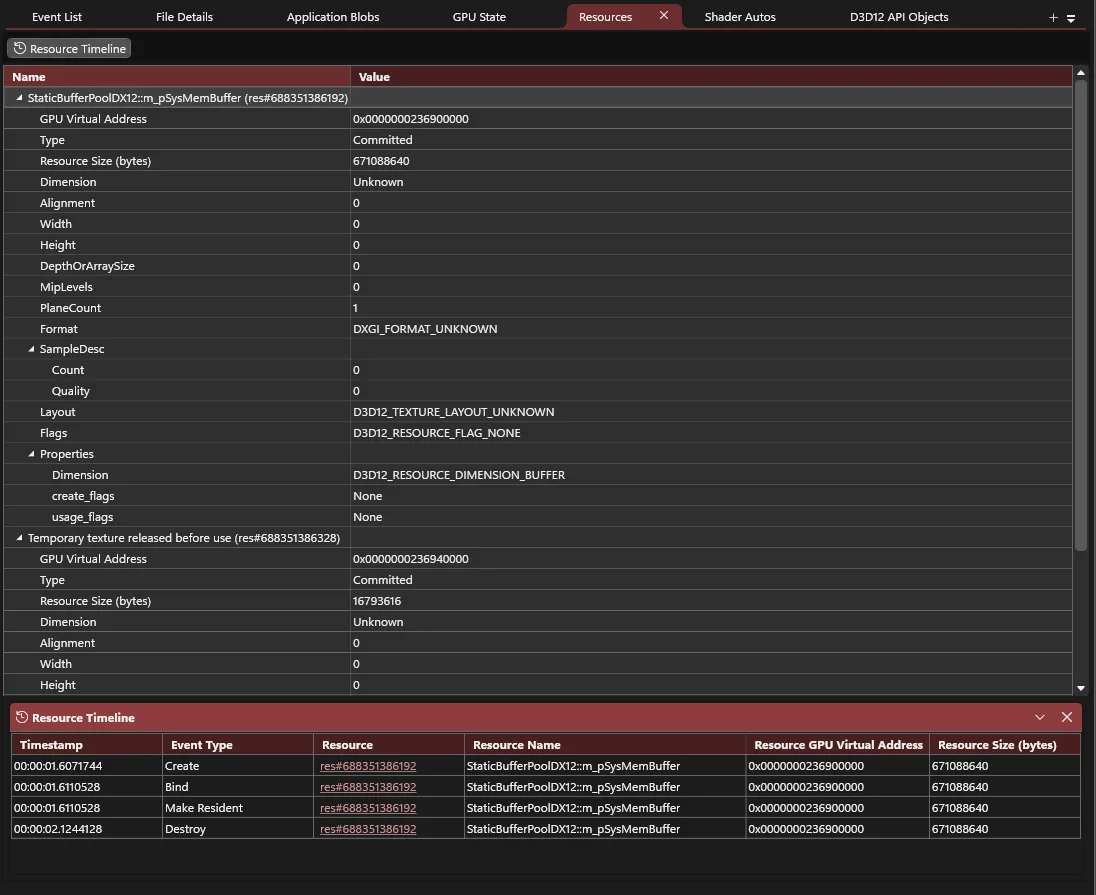
dxdmp file from adapter with driver support
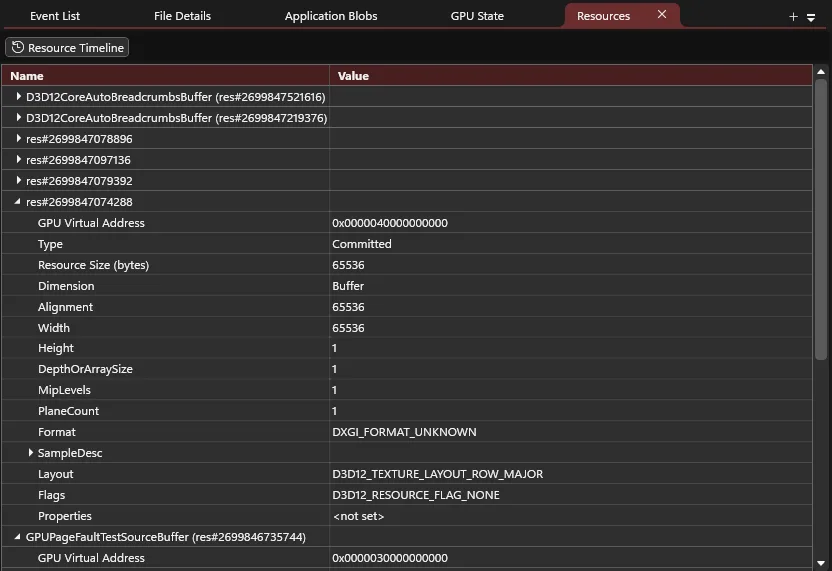
dxdmp file from adapter without driver support
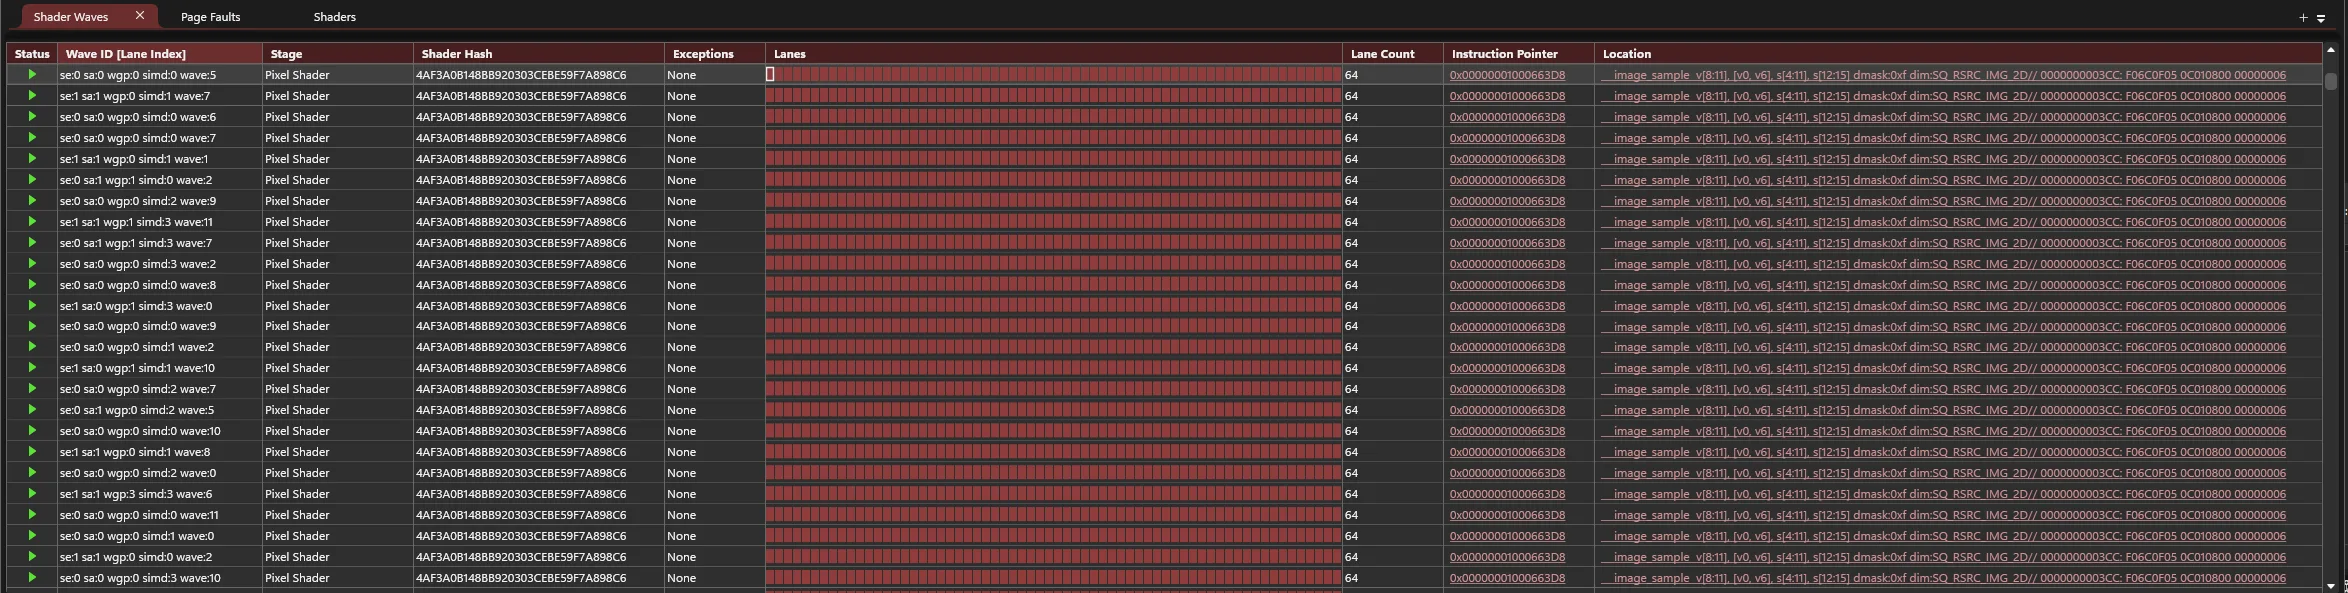
Shader Waves View
Lists all executing shader waves recorded at the time the dxdmp file was generated and information including their execution status, active lanes and lane count, shader stage, whether any exceptions were hit, the shader hash digest, and the corresponding instruction being executed.
dxdmp file from adapter with driver support
Shaders View
Displays the shader code of the executing shader waves. If the corresponding shader object files/binaries (generated by the HLSL compiler) are found via the ‘Shader Objects Options’ directories, PIX will parse the shader object to show the corresponding DXIL instructions and find the shader PDB hash.
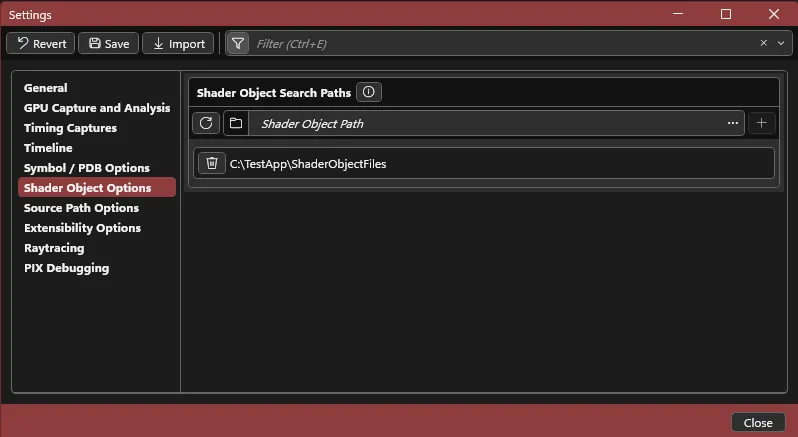
Shader object search paths available in PIX’s File > Settings dialog
If the corresponding full (-Zi -Fd) or slim (-Zs -Fd) shader PDBs (generated by the HLSL compiler) are found via the ‘PDB Search Paths’ directories, PIX will parse the PDB to show the corresponding HLSL source code.
If the PDB is embedded in the shader object (-Zi -Qembed_debug), only the shader object is needed to show DXIL and HLSL.
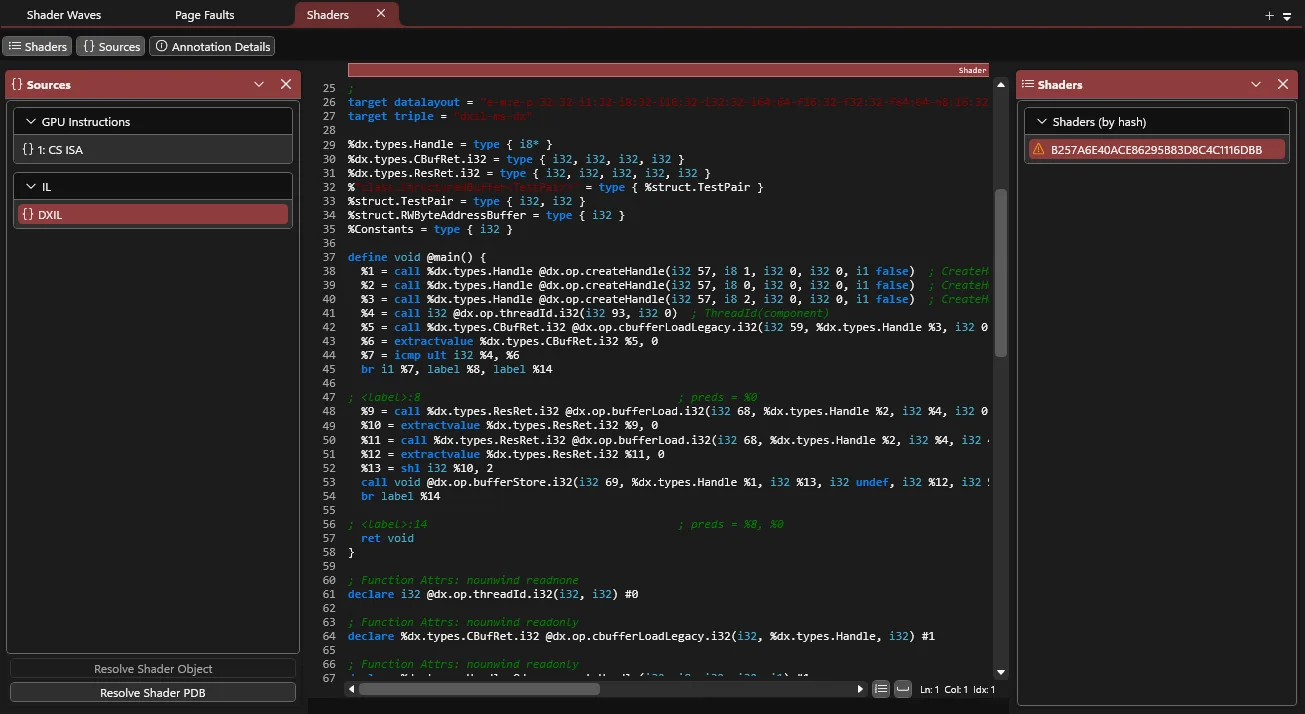
DXIL from a test app after resolving the corresponding shader object
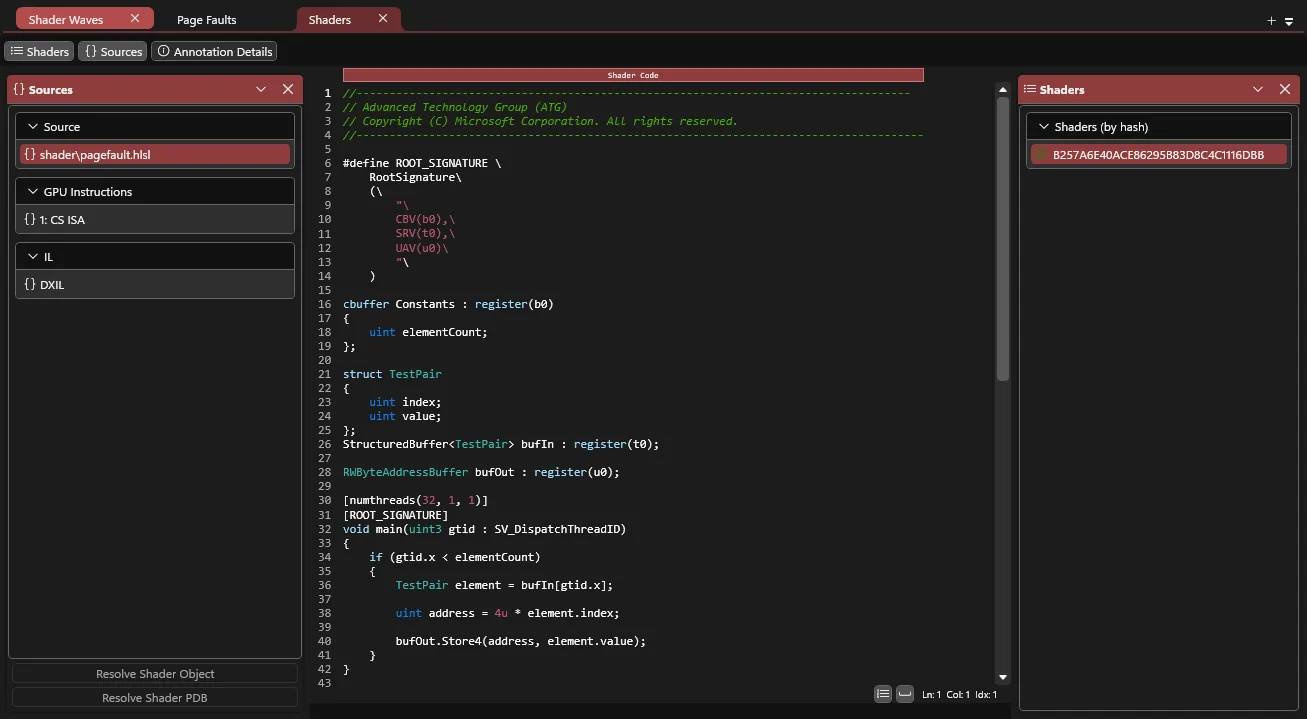
HLSL from a test app after resolving the corresponding shader PDB
PIX does not have support for HLSL level or IL level mappings yet.
Offending shader instructions that should be investigated further are highlighted and indicated with an error icon. The location of all active shader waves executing the shader are also highlighted.
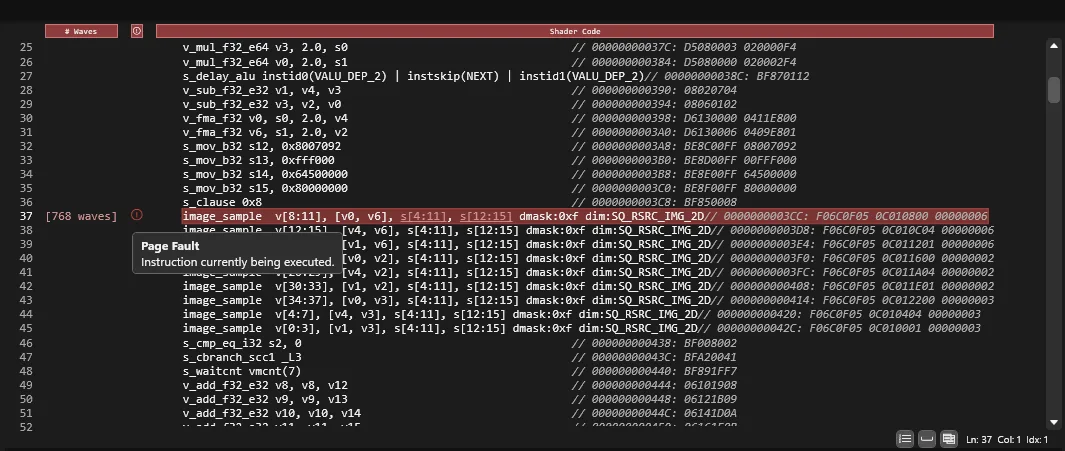
dxdmp file from adapter with high overhead mode enabled
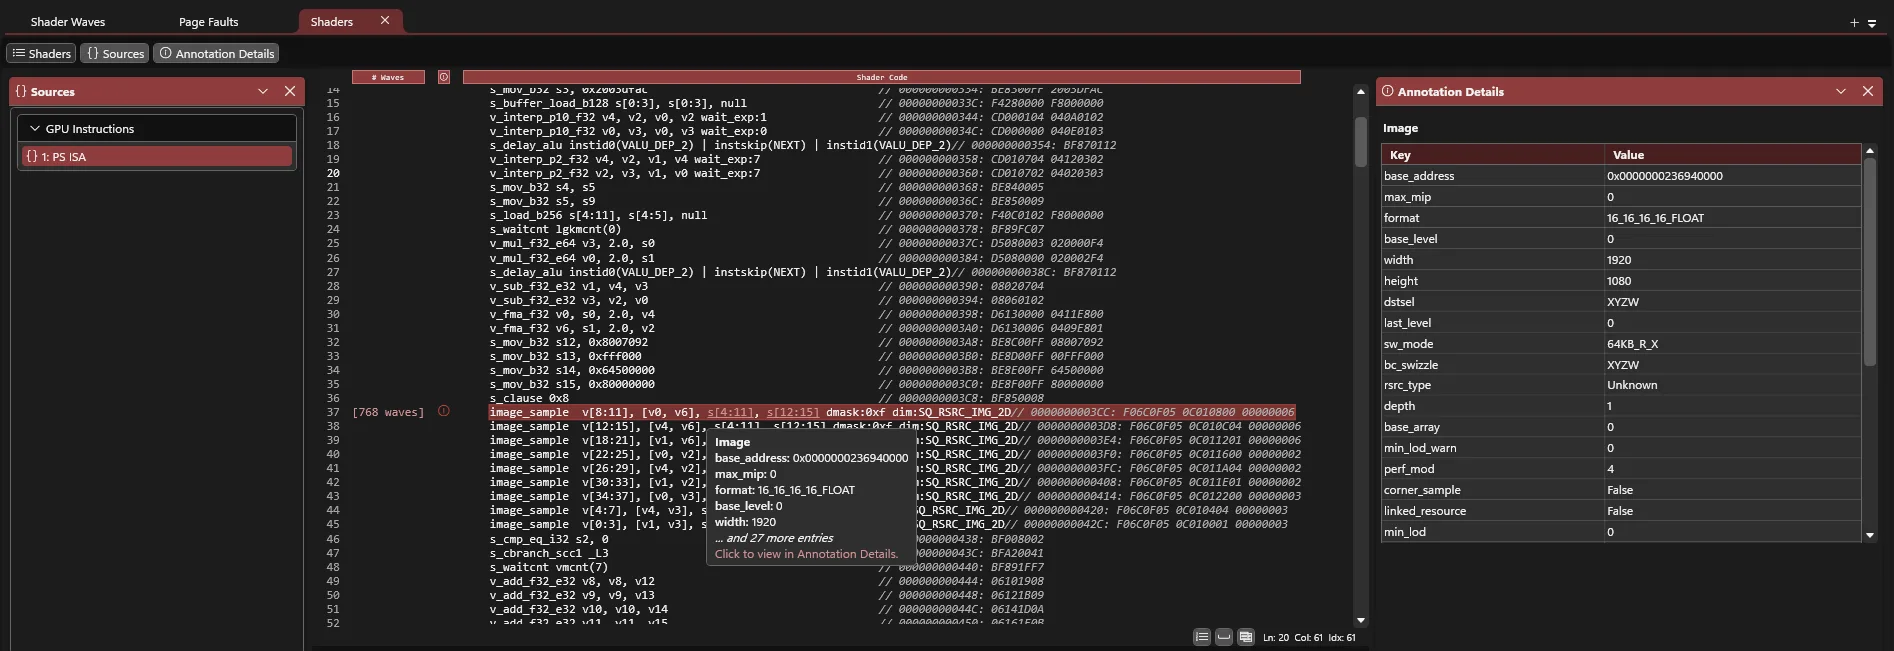
dxdmp file from adapter with high overhead mode enabled decoding an image descriptor
Shader ISA can also be annotated with useful information such as if the instruction uses a shader resource descriptor such as an image, buffer, sampler, or BVH, PIX will highlight the corresponding registers and decode the descriptor properties in the ‘Annotation Details’ panel.
Shader Autos View
Displays shader registers corresponding to the selected shader wave and lane. Selecting a different shader wave and lane in the shader waves view will update the selection in the autos view.
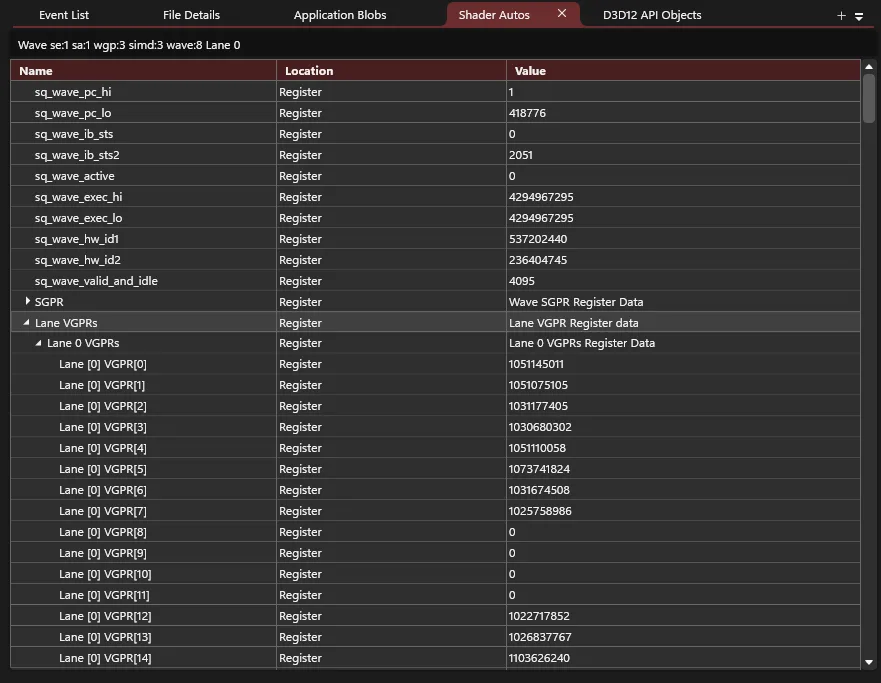
dxdmp file from adapter with high overhead mode enabled
D3D12 API Objects View
Lists objects including command queues and command allocators captured from the D3D runtime at the time the dxdmp file was generated.
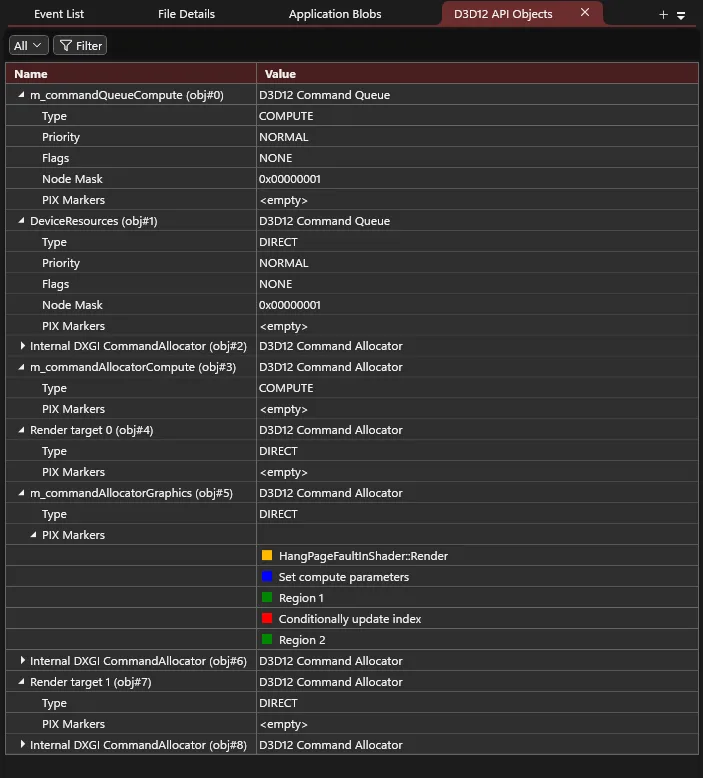
dxdmp file from adapter without driver support
Application Blobs View
Displays all blobs and metadata added by the application via AddBlobToDump.
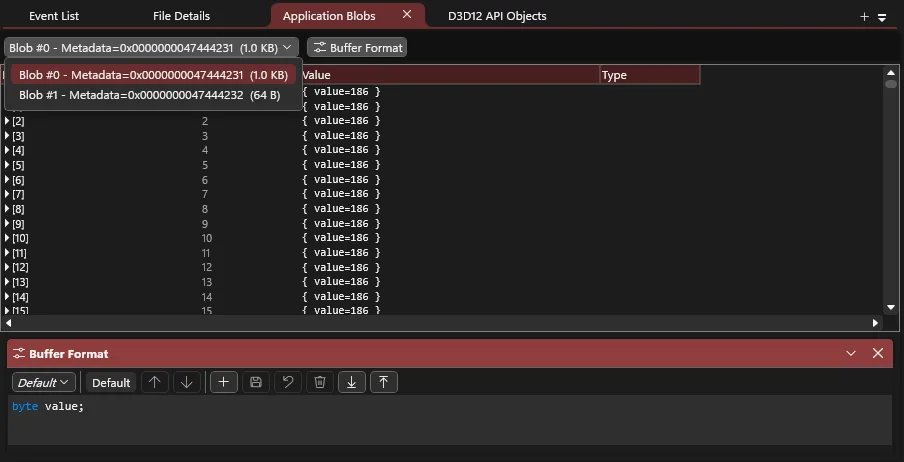
dxdmp file from adapter without driver support
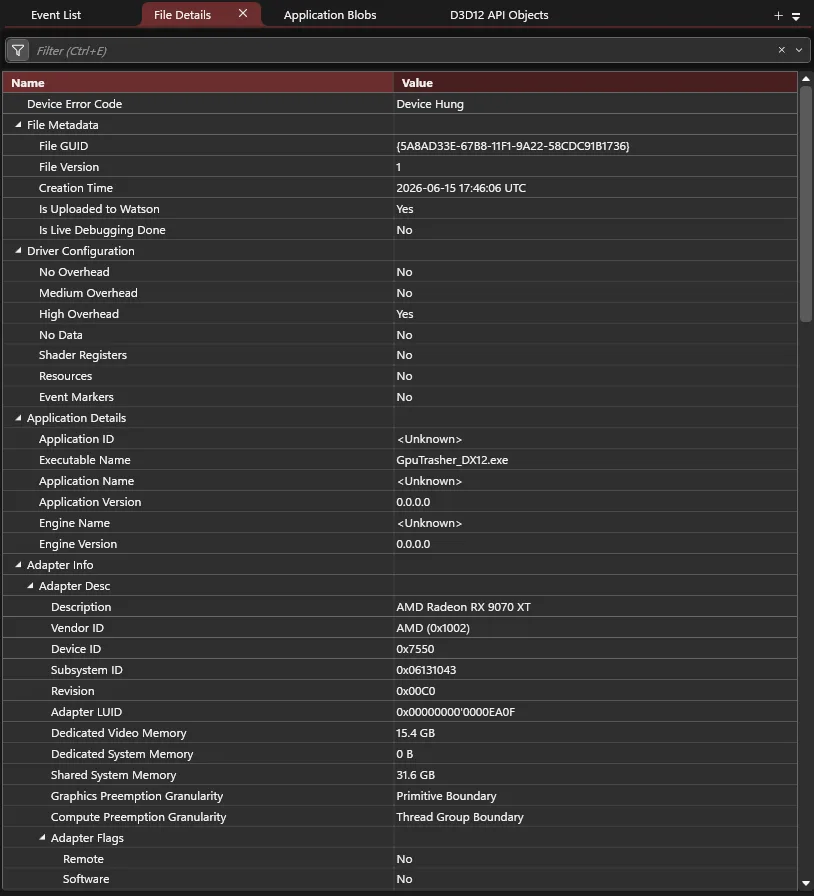
File Details View
Lists configuration information when the dxdmp file was generated including driver configuration, faulting application information, adapter info, device configuration, OS information, etc.
PIX API
In addition to interactive analysis in the PIX UI, developers can also process dump files programmatically using the PIX API, making it possible to integrate GPU crash diagnostics into automated pipelines and large-scale analysis workflows.
Documentation on the PIX API is located in the PIX install directory, and samples utilizing the API can be found at pix-samples.
Extended PIX Markers
Many developers already use PIX markers to add meaningful context to GPU workloads. Extended PIX Markers make those same annotations available in DirectX Dump Files, helping reconstruct where the GPU was in the application’s frame when a crash occurred.
In practice, this means existing marker hierarchies can now become part of your crash debugging workflow. If you’re already using PIX markers today, much of your existing instrumentation can be reused to provide richer postmortem diagnostics with minimal effort!
Extended PIX Markers work by allowing marker data to propagate through the Direct3D runtime to supported GPU drivers, where it can be captured and included in DirectX Dump Files. This means that hardware support varies by vendor and driver version.
Developers will need to configure the runtime to use Extended Markers.
For detailed information, please see: D3D12: PIX Markers | DirectX-Specs.
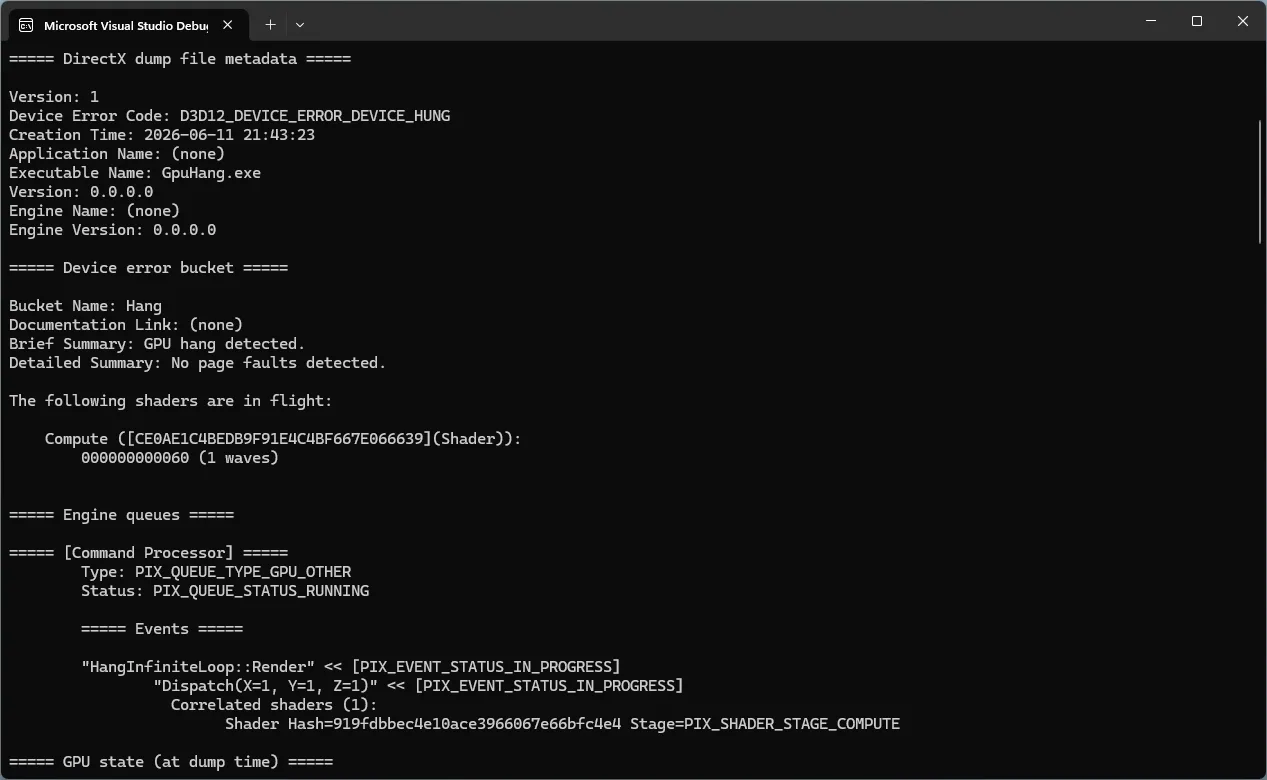
Using DebugBreak() to create a .dxdmp file
Developers can also use the new HLSL DebugBreak() intrinsic to intentionally generate a DirectX Dump File when a shader encounters an unexpected condition.
When the *_DEBUG_BREAK_ALWAYS_HALT flag is enabled for a pipeline or state object, a DebugBreak() will halt shader execution and trigger the same TDR workflow used for real-world GPU crashes.
This causes Windows to generate a .dxdmp file, allowing developers to capture and analyze the state of the GPU at the point of failure. Combined with PIX, this provides a powerful way to investigate rare shader issues and collect actionable debugging data without relying on fragile techniques such as infinite loops or manually reproducing issues.
For more detailed information on D3D12 debug breaks, refer to D3D12: Debug Break | DirectX-Specs.
Release Notes
Before enabling Retail Markers, ensure your graphics driver supports retail annotations. Your application may crash if this feature is enabled on unsupported drivers. This will be fixed in a subsequent Agility SDK point release.
0 comments
Be the first to start the discussion.