XAML UI Responsiveness tool in Visual Studio 2013
(Posting for a team mate and friend Pratap Lakshman)
From the perspective of interaction-performance applications need to be “fast” and “fluid” – fast to launch, to navigate between pages, to react to changes in orientation, and fluid in scrolling, in panning and in animations. This post introduces the XAML UI Responsiveness tool, a new tool in the Visual Studio Performance and Diagnostics hub that lets you analyze such interaction-performance of your XAML-based Windows Store applications.
The need for a specialized tool
Traditional performance analysis has approached “fast” interaction from the perspective of what it would take to get from point A to point B in the least amount of time. In this approach one would look at the activities happening in the code path to say, navigate from page A to page B, and optimize around that. Unfortunately this approach might not work in the case of framework-based applications because the costs that you incur in getting to page B could well be in framework code that is doing work on behalf of the application.
Getting to “fluid” interactions introduces other complexities. Consider getting to fluid animations – this requires rendering at close to 60 FPS, and at the rate the display hardware needs to refresh the screen once every 16.7 ms. In order to get to fluid animation, the state of the object being animated has be to updated at every such refresh of the screen. This imposes a hard deadline by when any activity being done by the application, or by the framework on behalf of the application, must render to screen.
The XAML UI Responsiveness tool is a specialized application performance analysis tool being introduced in Visual Studio 2013 for Windows Store based applications to address these interaction-performance concerns.
Using the XAML UI Responsiveness tool
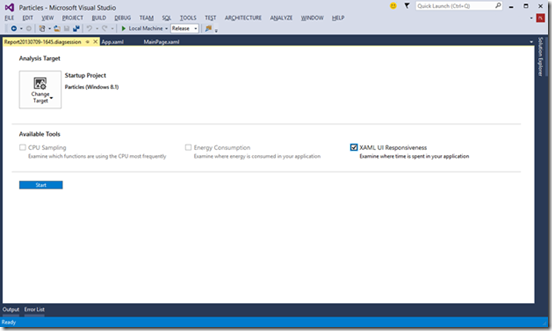
Discovery of the XAML UI Responsiveness tool, and indeed of all the performance and diagnostics tools in Visual Studio has been made easy by aggregating them on a single launch page – the Performance and Diagnostics hub. Launching the hub using “Debug -> Performance and Diagnostics” automatically presents all the tools relevant to the selected analysis target application. The Startup Project is the Analysis target by default.

The tool works on applications deployed to run either locally, or in the Simulator, or on a remote machine. The deployment target dropdown allows selection of “Local Machine”, “Simulator” or “Remote Machine” for this purpose. Profiling on a “Remote Machine” is especially relevant from a performance analysis perspective – one cannot make any assumptions about the hardware on which the application is installed by the consumer, and as an application developer one must strive to ensure consistent performance across the range of supported hardware configurations. To run a profiling session on any remote hardware on which you want to assess performance, Configure remote profiling on the remote device and then select “Remote Machine” as target in target selection drop down box.
Select “XAML UI Responsiveness” and click on “Start” to deploy and launch the application and begin a profiling session.
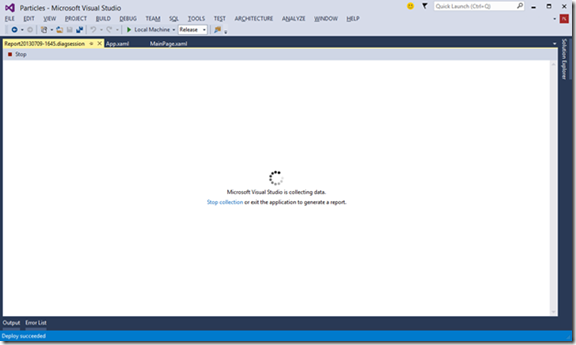
To end the profiling session after exercising the scenario, click either “Stop” or “Stop collection”.

This will exit the application and present the profiling report (shown below) for analysis.
Elements of the profiling report user interface
The tool reports performance in the parlance of elements and various XAML services. Here is a brief introduction of the user interface (we will delve into details in upcoming posts).

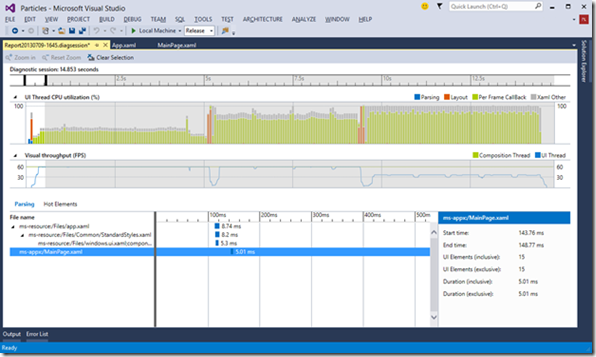
Let’s look at the various sections from top to bottom referencing the screenshot above.
(1) Zoom: The Zoom/Selection controls above the ruler can be used to zoom in/out of a selected time range. “Clear Selection” causes the entire time range to be in scope, and that is the default as well.
(2) Ruler: The Ruler indicates the duration of the scenario. The handles on the ruler can be used to scope the time range over which drill down analysis data is presented. In the present case, notice that the screen shot shows approximately the initial 500 ms as the selected time range.
(3) UI Thread Utilization:The “UI Thread utilization” swim lane reports the load on the UI thread under the broad categories of “Parsing” of XAML, “Layout”, application code execution (note that a “Per Frame Callback executes application code), and “Xaml Other” which includes activities within the XAML framework for submitting frames for final presentation on screen.
(4) Visual Throughput: The “Visual throughput” swim lane reports the frame rates from the threads bearing the workload of getting your content on screen – the UI thread and the Composition thread.
The bottom half of the user interface presents drill down tabbed views into the information plotted on the UI thread utilization swim lane; in particular about the XAML that was parsed, and the elements that participated in layout.
(5) Parsing: The “Parsing” view tab reports the XAML parsed within the selected time range. It comprises of three panes. The left pane represents the hierarchical list of files parsed; i.e. the files that were parsed and the sequence in which they were parsed. Each row represents a file that was parsed, and clicking on a row expands the hierarchy. The middle pane represents the same hierarchy as a Gantt chart illustrating the start, end, and duration of parsing for each of the files. The right pane represents metadata for each selected file. This metadata includes a breakdown of the start/end time for parsing the file, inclusive/exclusive durations and inclusive/exclusive counts for the UI elements instantiated.

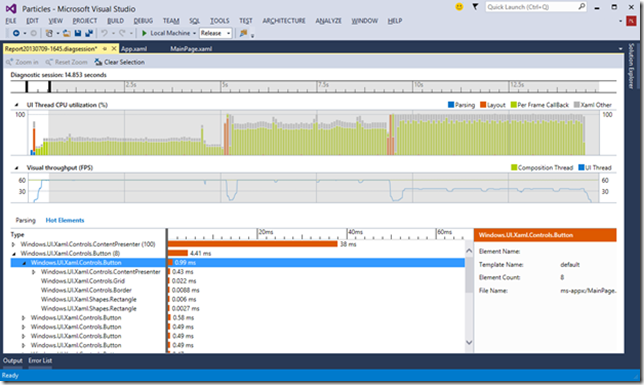
(6) Hot Elements: The “Hot Elements” view, in the adjacent tab, reports all the elements that participated in layout within the selected time range. It too comprises of three panes. The left pane represents all of the elements that participated in layout, and these elements are grouped by their template and sorted in descending order, so that the costliest group of items float to the top. Clicking on a row expands the group to its constituents. The middle pane represents the layout cost as a horizontal bar graph. For an element group on the left pane, the bar represents cumulative cost of laying out all the constituents of the group. The right pane represents metadata for each selected element or element-group from the left pane. This metadata includes the name of the element (if provided), the name of the file in which the element is found, the name of its template, the number of elements added as a consequence of applying the said template.
In Closing
The UI Responsiveness tool is a post-mortem profiler, and the various user interface elements as described above can be used to reason about the startup, page navigation, and panning/scrolling performance of your XAML-based Windows Store application. In upcoming posts we will cover details on how to use the tool and interpret its results, but until such time, to see the tool in action, please take a look at our //build/ talk titled Visual Studio 2013 Diagnostics Tools for XAML-Based Windows Store Apps.
We are really interested in knowing more about what you think about the tool and what you would like to see supported going forward – please let us know via UserVoice or Connect, and by asking questions in our MSDN diagnostics forum!

 Light
Light Dark
Dark
0 comments