
Remember the last time you worked with unfamiliar code? It can seem like it takes forever to understand how to change it and even longer to see the potential impact. What if you had a picture that shows how the code is organized and gives you more information about how changes might affect it?
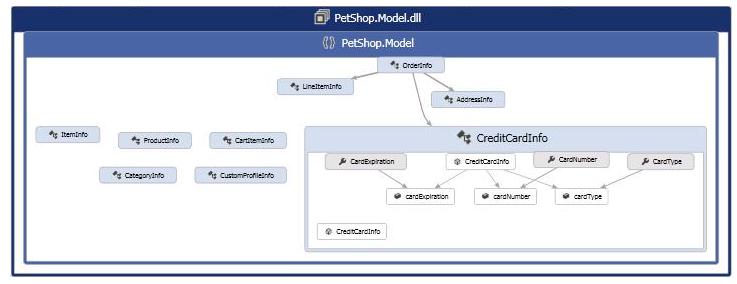
Good news! In Visual Studio 11 Beta, you can visualize your code and understand its relationships. You can create, read, and edit dependency graphs faster and easier. Here’s an example:
Note: You can create graphs with Visual Studio 11 Ultimate. You can read and edit graphs with Visual Studio 11 Premium and Professional. To download the Visual Studio 11 Beta ALM virtual machine, which includes the Ultimate version, and hands-on-labs, see Brian Keller’s post here.
This blog post covers the following scenarios and uses the .NET Pet Shop 4.0 sample application in its examples:
To magnify the examples, just click them.
To get an overview of the code, follow these steps:
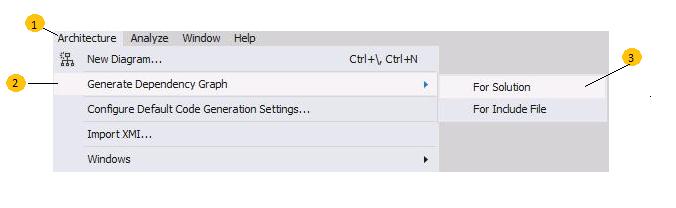
The first time you generate a graph, it might take a little while. Visual Studio builds the solution, analyzes the binaries produced from each project, and indexes relevant details to generate future graphs faster. If you don’t need a graph for the entire solution, you can also speed up this process by visualizing only those parts that you care about or narrowing the scope of your solution. To learn more, see Focusing on the Details and How to: Visualize Code by Generating Dependency Graphs.
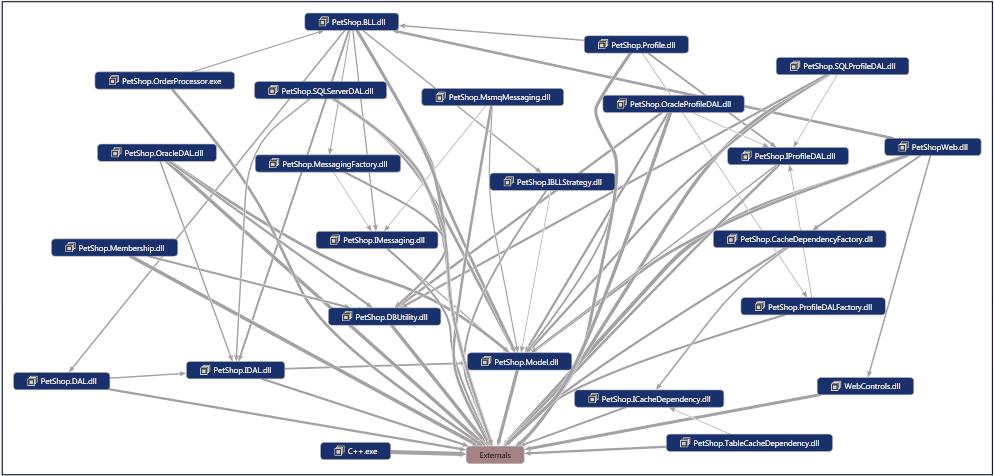
This example shows the top-level assemblies in the sample solution. Everything outside the solution, like platform dependencies, is found in Externals:
To save the graph:
- Open the shortcut menu for the graph surface, choose Move <graphname.dgml> into, and then choose Solution Items.
- When the Save File As box appears, name the graph document, and save it.
Visual Studio saves the graph to the Solution Items folder.
Browsing Dependency Graphs
The resulting graph can seem large and overwhelming. You have several ways to explore the graph:
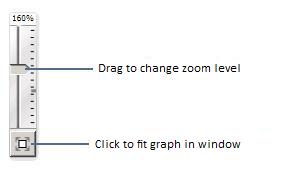
- To zoom in and out, rotate the mouse wheel, or drag the slider in the upper left corner of the graph.
- To pan the graph, drag the graph surface in any direction.
- To fit the entire graph into the window, double-click the graph surface, or click the zoom-to-fit button under the zoom slider.
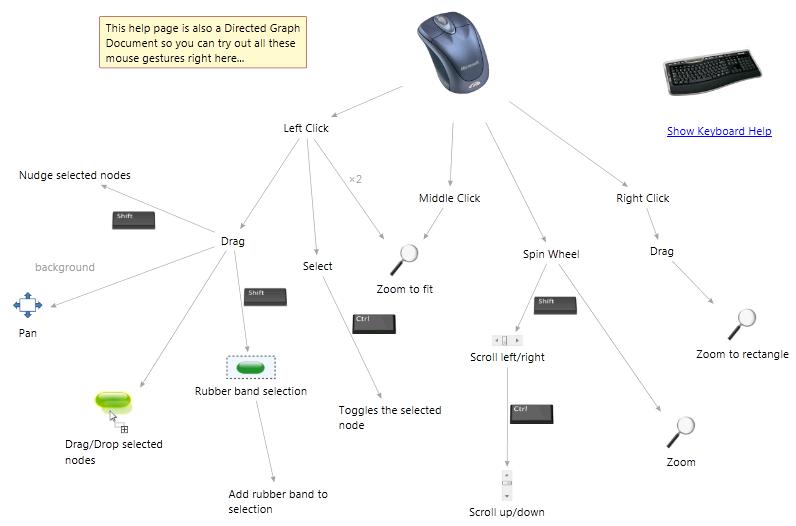
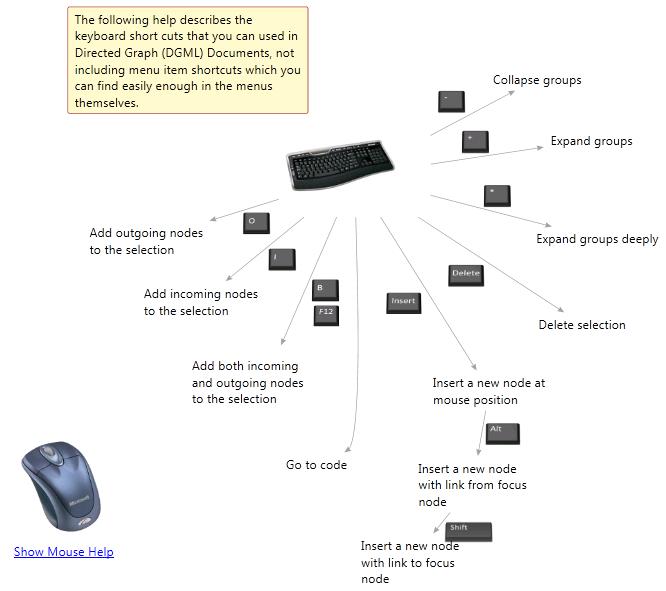
For other ways to explore graphs, see How to: Browse and Rearrange Dependency Graphs. To see more mouse and keyboard gestures, create a blank graph, and then choose the Help links on the graph:
Examining Items and Relationships
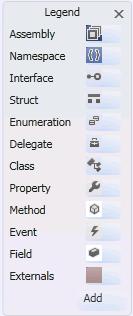
A rectangle, or node, represents an item on the graph. An icon identifies the item’s type. To see what the icons mean, use the Legend:
Some items contain other items, for example, assemblies contain namespaces, which contain types, and so on. To expand these containers, or groups, move the mouse pointer over the left part of a node. If a ![]() appears, choose it.
appears, choose it.

To expand and collapse groups, use these keyboard shortcuts:
- To expand a selected group, use the plus key (+).
- To expand successive levels of groups, use the asterisk key (*****).
- To collapse a selected group, use the minus key (-).
If an expanded group seems too big, you can drag its contents to rearrange them. The layout of the surrounding nodes and links adjust automatically:
**Layout Before Rearranging **
Layout After Rearranging

Arrows, or links, between nodes represent relationships. If there are multiple relationships between two nodes, a single aggregate link combines all those relationships into one link.
To learn more about a relationship between two nodes:
- Select nodes that you want to focus on.
- Open the shortcut menu for the selection, choose Select, and Hide Unselected to hide everything else. The graph is just a one-way view of the code, so you can edit the graph without changing the code.
- Move the mouse pointer on top of a link. This shows a tooltip with details about the link and also arrows that let you move between the source and target nodes. Use these arrows when the graph has too many items and you want to see which nodes are connected.
The following example shows two assemblies. The tooltip tells you that the aggregate link represents multiple relationships: Calls, References, and Return. The denser the link, the more relationships it represents:

To see all the links between the items in these assemblies, make sure the graph shows all cross-group links:

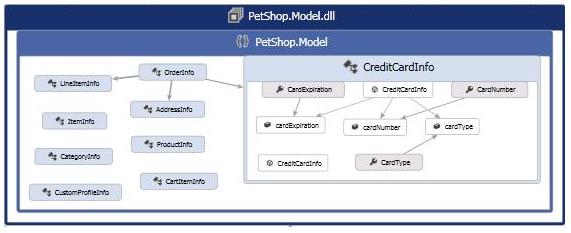
Expand the assemblies and namespaces to see the links between their contents:

Now, suppose you only care about a specific area of code because you have to fix a bug or update some functionality. You want to know how that change affects other parts of the code. For example, maybe you want to update the CreditCardInfo constructor to accept an authorization code. There are several ways to find that code:
- If the CreditCardInfo method is on the graph, use the graph search tool to find it. Then, follow the links to find items that depend on that method.
- If the CreditCardInfo method isn’t on the graph, use Solution Explorer to find the CreditCardInfo method and items that depend on that method. Select those items in Solution Explorer, and then drag them to an existing graph or create a new graph.
Finding Items on Graphs
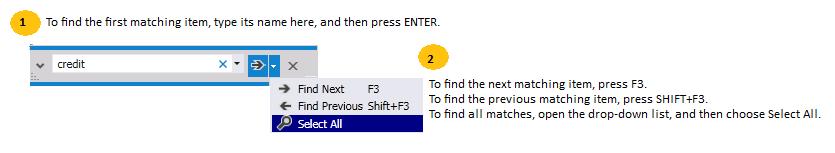
To find any items on the graph, use CTRL+F to open search:
- Type the item’s name, and then press ENTER. The first matching item appears selected on the graph. Note: By default, search includes items in collapsed groups. However, if an item is in collapsed group that was never expanded, the item might not be found. Make sure you have expanded all the groups at least once.
- To see the next match, press F3 or choose the** Find Next** arrow. To see all matching items, open the drop-down list, and choose Select All.
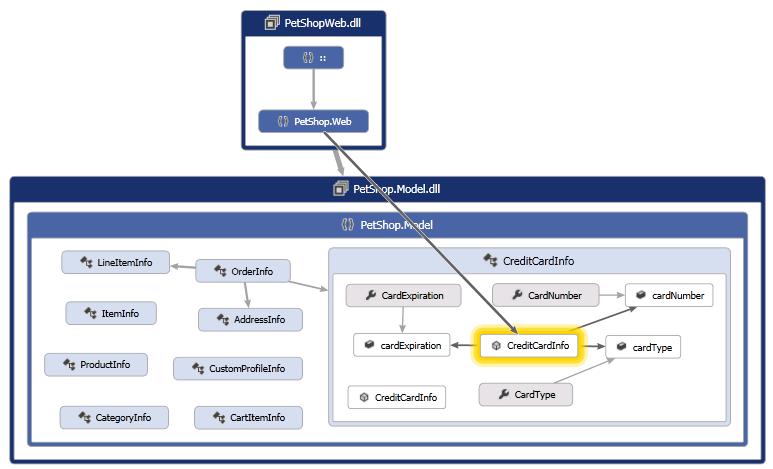
The following matches appear selected on the graph:

To see the CreditCardInfo method definition, select it on the graph, and use F12 to open the code editor. Now, suppose you want to find other code that has dependencies on this method. To see items that have dependencies on a selected item, make sure that you can see the cross-group links for selected items. On the graph toolbar, open the  list, and choose Show Cross-Group Links on Selected Nodes.
When you select the CreditCardInfo method, a link appears from PetShopWeb.dll and points at CreditCardinfo, showing that something in PetShopWeb.dll calls CreditCardInfo:
To find the methods in PetShopWeb.dll that call CreditCardInfo, expand PetShopWeb.dll incrementally and follow the links:

Finding Items in the Solution
To start from the solution, search or browse for the CreditCardInfo method in Solution Explorer. If you search, you find the following:
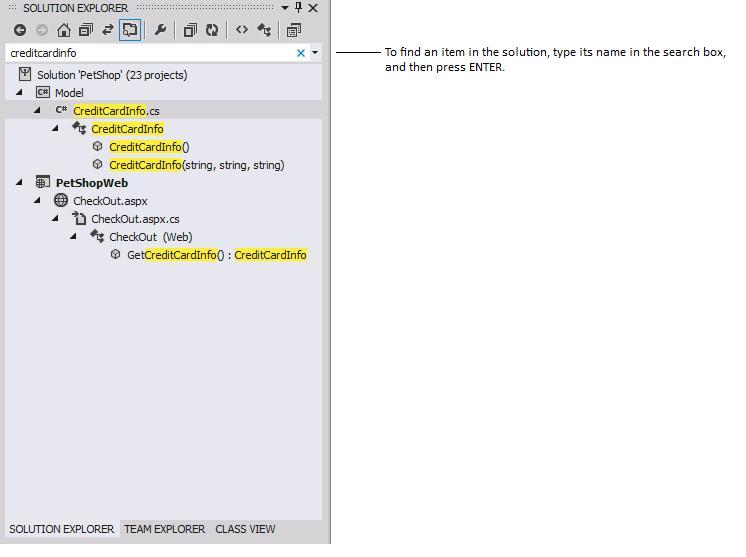
When you select the CreditCardInfo method, Visual Studio shows the method’s definition in the code editor:

Without leaving Solution Explorer, you can find what calls CreditCardInfo method, what CreditCardInfo calls, or what uses it. Open the shortcut menu for the CreditCardInfo method, and choose Is Called By:

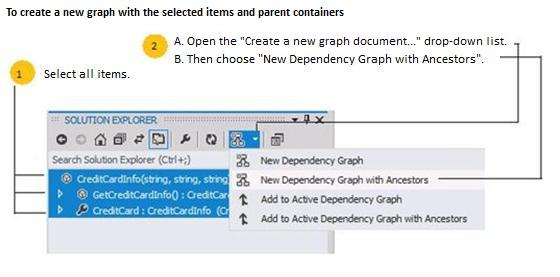
You see that two items that call CreditCardInfo. Select each item, and use F12 to see their definitions. You can create a new dependency graph that shows only these items and their relationships with CreditCardInfo:
which produces the following graph:

To see the missing children in these groups, choose Refetch Children  on each group. Visual Studio shows them on the graph:

To add more related items to the graph, open the shortcut menu for a node, follow these steps:

Now, suppose you come across dependencies on the graph that shouldn’t exist. Suppose you want to propose changes to these dependencies and use the graph to discuss your suggestions with your team. You can edit the graph several ways:
- Add new undefined nodes, linked nodes, comments, or groups. To do this, choose the node where you want to add these items. When the floating menu appears, choose the corresponding task.

- Add new types, members, and also their parent containers to the graph. To do this, select the types and members in Solution Explorer, and then drag the items to the graph. To include the parent containers, press and hold the CTRL key while you drag the items. Or, you can open the Create a new graph document… list on the Solution Explorer toolbar (make sure the dependency graph is visible), and choose Add to Active Dependency Graph with Ancestors.

* Rename nodes by editing their labels. * Delete nodes and links, or retrieve hidden ones on the graph. * Hide nodes or show hidden nodes more easily. * Organize nodes into groups. * Change the styles and appearances of nodes and links.
To learn more about how to edit dependency graphs, see How to: Edit and Customize Dependency Graphs.
To let us know what you think:
- For questions or discussion: Visual Studio Visualization & Modeling Forum
- For feature suggestions: Visual Studio User Voice (Visual Studio Ultimate)
- For bugs: Microsoft Connect
0 comments