In Update 2 of Visual Studio 2013, we added the CPU Usage tool into the Performance and Diagnostics hub which allows you to see where the CPU is spending time executing your code. In Update 3 of Visual Studio 2013, we have made a small but important improvement to this tool: the ability to navigate from a function in the call tree to the source code where that function was defined.
When you have found an interesting function to look at in the call tree, you can right-click on it and select “View Source” or select the line and press Ctrl+G:

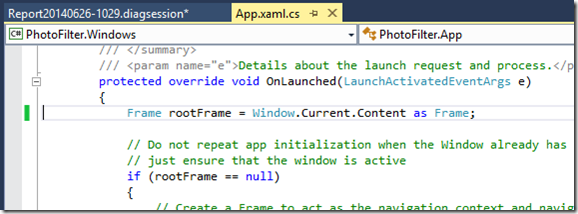
After you do that, the editor will open the corresponding source file with the cursor in the function that you selected:

This works for C#/VB, C++, and JavaScript code, and saves you from having to search through your solution and manually navigate to the function (the exact line within the function can vary in Release mode due to optimizations).
Sometimes clicking “View Source” will take you to the top of a file instead of a specific function. If this happens it usually means the selected function is code that was generated by the compiler or the runtime. The code was generated on behalf of a function in the file you were taken to, but we take you to the top of the file since there is no actual code to show you.
The “View Source” option will be disabled if we could not find symbol files (PDBs) for the module or if the matching source file no longer exists at the path embedded in the PDBs. This is usually the case when looking at External Code. In the example below, I clicked “Filter view” and checked the “Show External Code” option, which reveals code in Newtonsoft’s Json.NET library, but I cannot click “View Source” on functions in this library because I do not have the source code or the symbol files for this library on my machine.

It will also be disabled if the available PDBs don’t have line-level information. For example, line-level information usually missing for managed code when profiling NGen modules (indicated by the module name ending with .ni.dll) unless you manually generate NGen PDBs with line information, and for framework code where the PDBs were retrieved from Microsoft’s public symbol servers.
If you try out this feature and have feedback for us, be sure to use Send-a-Smile or UserVoice for feature requests and let us know on the Forums if you run into issues. Enjoy!

0 comments