Update: Note this post has been updated for Visual Studio 2013 RTM and is the first of a two-part series. In the screenshots and examples Just My Code and Collapse Small Objects are disabled as covered in part 2. It is recommended that you read this post before reading part 2.
One of the issues that frequently affects .NET applications running in production environments is problems with their memory use which can impact both the application and potentially the entire machine. To help with this, we’ve introduced a feature in Visual Studio 2013 to help you understand the .NET memory use of your applications from .dmp files collected on production machines.
In this post, I’ll first discuss common types of memory problems and why they matter. I’ll then walk through an example of how to collect data, and finally describe how to use the new functionality to solve memory problems in your applications.
Before I begin, there are a few things to note about the “Debug Managed Memory” feature discussed in this post:
- The option will only be available from the dump summary page in the Ultimate version of Visual Studio 2013. If you are using Premium or Professional you will not see the option
- The process the dump file was collected against must have been running on .NET 4.5 or higher. If the dump was collected on 3.5 or previous the option will not appear, if it was collected on 4.0 it will fail to launch with an error message.
Why worry about memory problems
.NET is a garbage collected runtime, which means most of the time the framework’s garbage collector takes care of cleaning up memory and the user never notices any impact. However, when an application has a problem with its memory this can have a negative impact on both the application and the machine.
- **Memory leaks **are places in an application where objects are meant to be temporary, but instead are left permanently in memory. In a garbage collected runtime like .NET, developers do not need to explicitly free memory like they need to do in a runtime like C++. However the garbage collector can only free memory that is no longer being used, which it determines based on whether the object is reachable (referenced) by other objects that are still active in memory. So a memory leak occurs in .NET when an object is still reachable from the roots of the application but should not be (e.g. a static event handler references an object that should be collected). When memory leaks occur, usually memory increases slowly over time until the application starts to exhibit poor performance. **Physical resource leaks **are a sub category of memory leaks where a physical resource such as a file, or OS handler is accidentally left open or retained. This can lead to errors later in execution as well as increased memory consumption.
- **Inefficient memory use **is when an application is using significantly more memory than intended at any given point in time, but the memory consumption is not the result of a leak. An example of inefficient memory use in a web application is querying a database and bringing back significantly more results than are needed by the application.
- **Unnecessary allocations. **In .NET, allocation is often quite fast, but overall cost can be deceptive, because the garbage collector (GC) needs to clean it up later. The more memory that gets allocated, the more frequently the GC will need to run. These GC costs are often negligible to the program’s performance, but for certain kinds of apps, these costs can add up quickly and make a noticeable impact to the performance of the app
If an application suffers from a memory problem, there are three common symptoms that may affect end users.
- The application can crash with an “Out of Memory” exception. This is a relatively common problem for 32bit applications because they are limited to only 4GB of total Virtual Address Space. It is however less common for 64bit applications because they are given much higher virtual address space limits by the operating system.
- The application will begin to exhibit poor performance. This can occur because the garbage collector is running frequently and competing for CPU resources with the application, or because the application constantly needs to move memory between RAM (physical memory) and the hard drive (virtual memory); which is called paging.
- Other applications running on the same machine exhibit poor performance. Because the CPU and physical memory are both system resources, if an application is consuming a large amount of these resources, other applications are left with insufficient amounts and will exhibit negative performance.
In this post I’ll be covering a new feature added to Visual Studio 2013 intended to help identify memory leaks and inefficient memory use (the first two problem types discussed above). If you are interested in tools to help identify problems related to unnecessary allocations, see .NET Memory Allocation Profiling with Visual Studio 2012.
Collecting the data
To understand how the new .NET memory feature for .dmp files helps us to find and fix memory problems let’s walk through an example. For this purpose, I have introduced a memory leak when loading the Home page of a default MVC application created with Visual Studio 2013. However to simulate how a normal memory leak investigation works, we’ll use the tool to identify the problem before we discuss the problematic source code.
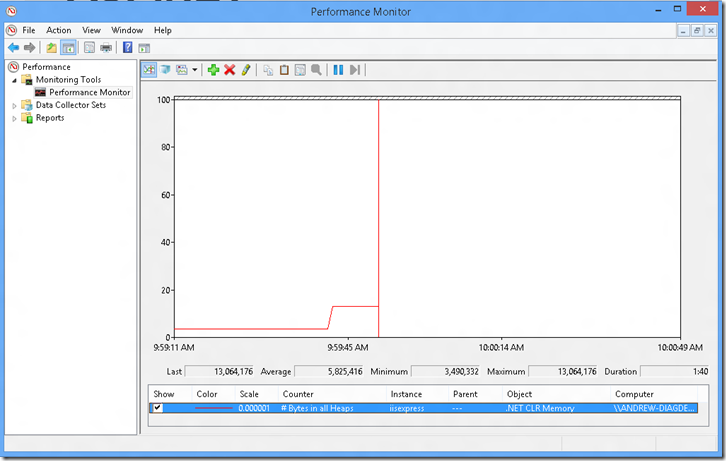
The first thing I am going to do is to launch the application without debugging to start the application in IIS Express. Next I am going to open Windows Performance Monitor to track the memory usage during my testing of the application. Next I’ll add the “.NET CLR Memory -> # Bytes in all Heaps” counter, which will show me how much memory I’m using in the .NET runtime (which I can see is ~ 3.5 MB at this point). You may use alternate or additional tools in your environment to detect when memory problems occur, I’m simply using Performance Monitor as an example. The important point is that a memory problem is detected that you need to investigate further.

The next thing I’m going to do is refresh the home page five times to exercise the page load logic. After doing this I can see that my memory has increased from ~3.5 MB to ~13 MB so this seems to indicate that I may have a problem with my application’s memory since I would not expect multiple page loads by the same user to result in a significant increase in memory.
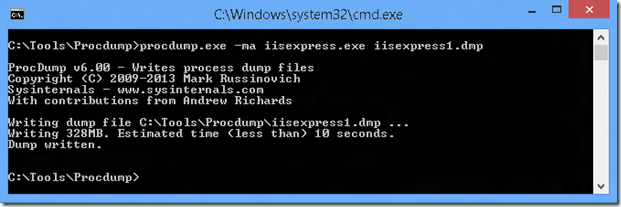
For this example I’m going to capture a dump of iisexpress.exe using ProcDump, and name it “iisexpress1.dmp” (notice I need to use the –ma flag to capture the process memory, otherwise I won’t be able to analyze the memory). You can read about alternate tools for capturing dumps in what is a dump and how do I create one?
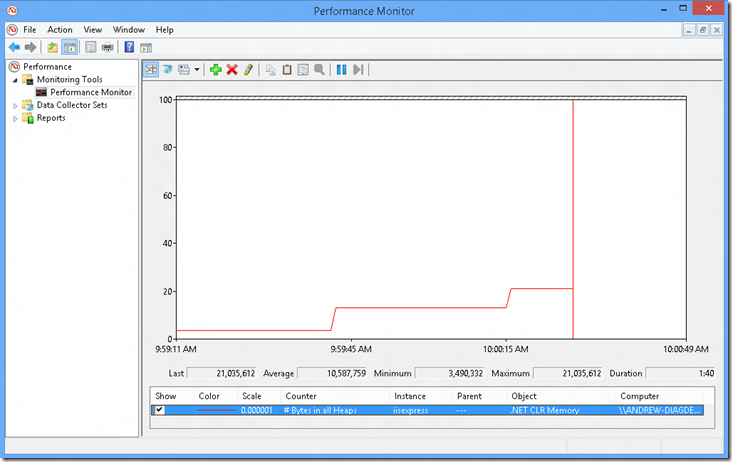
Now that I’ve collected a baseline snapshot, I’m going to refresh the page an additional 10 times. After the additional refreshes I can see that my memory use has increased to ~21 MB. So I am going to use procdump.exe again to capture a second dump I’ll call “iisexpress2.dmp”
Now that we’ve collected the dump files, we’re ready to use Visual Studio to identify the problem.
Analyzing the dump files
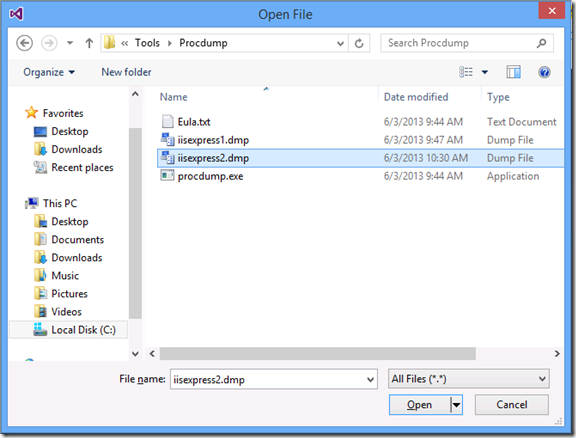
The first thing we need to do to begin analysis is open a dump file. In this case I’m going to choose the most recent dump file, “iisexpress2.dmp”.
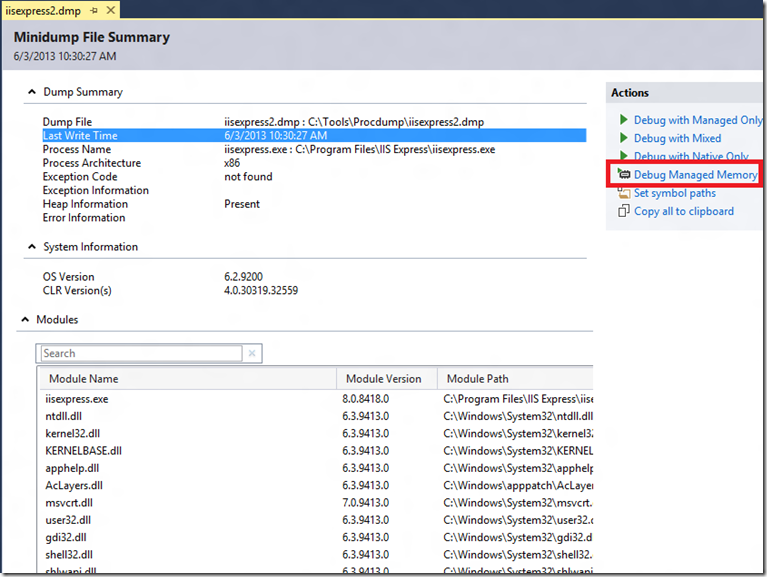
Once the file is open, I’m presented with the dump file summary page in Visual Studio that gives me information such as when the dump was created, the architecture of the process, the version of Windows, and what the version of the .NET runtime (CLR version) the process was running. To begin analyzing the managed memory, click “Debug Managed Memory” in the “Actions” box in the top right.
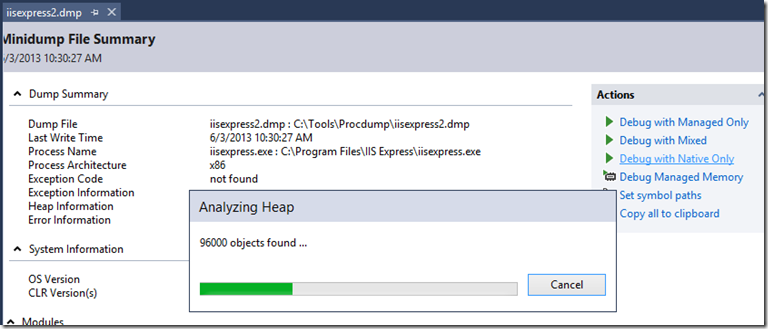
This will begin analysis
Once analysis completes I am presented with Visual Studio 2013’s brand new managed memory analysis view. The window contains two panes, the top pane contains a list of the objects in the heap grouped by their type name with columns that show me their count and the total size. When a type or instance is selected in the top pane, the bottom one shows the objects that are referencing this type or instance which prevent it from being garbage collected.
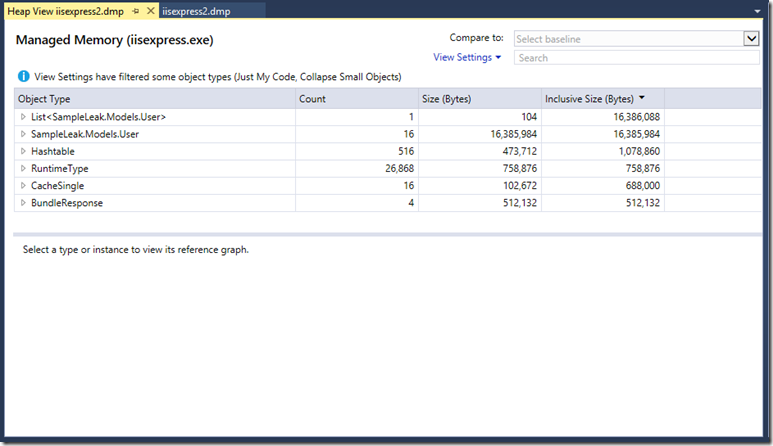
[Note: At this point Visual Studio is in debug mode since we are actually debugging the dump file, so I have closed the default debug windows (watch, call stack, etc.) in the screenshot above.]
Thinking back to the test scenario I was running there are two issues I want to investigate. First, 16 page loads increased my memory by ~18 MB which appears to be an inefficient use of memory since each page load should not use over 1 MB. Second, as a single user I’m requesting the same page multiple times, which I expect to have a minimal effect on the process memory, however the memory is increasing with every page load.
Improving the memory efficiency
First want to see if I can make page loading more memory efficient, so I’ll start looking at the objects that are using the most memory in the type summary (top pane) of memory analysis window.
Here I see that Byte[] is the type that is using the most memory, so I’ll expand the System.Byte[] line to see the 10 largest Byte[]’s in memory. I see that this and all of the largest Byte[]’s *are ~1 MB each which seems large so I want to determine what is using these large *Byte[]’s. Clicking on the first instance shows me this is being referenced by a SampleLeak.Models.User object (as are all of the largest Byte[]’s if I work my way down the list).
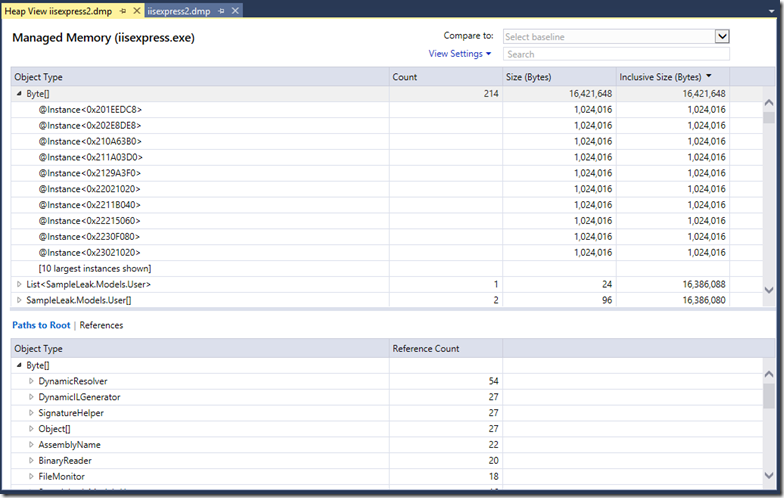
At this point I need to go to my application’s source code to see what User *is using the *Byte[] *for. Navigating to the definition of *User in the sample project I can see that I have a BinaryData member that is of type byte[]. It turns out when I’m retrieving my user from the database I’m populating this field even though I am not using this data as part of the page load logic.
public class User : IUser
{
…[Key]
public string Id { get; set; }public string UserName { get; set; }
public byte[] BinaryData { get; set; }
}
Which is populated by the query
User user = MockDatabase.SelectOrCreateUser(
“select * from Users where Id = @p1”,
userID);
In order to fix this, I need to modify my query to only retrieve the Id and UserName when I’m loading a page, I’ll retrieve the binary data later only if and when I need it.
User user = MockDatabase.SelectOrCreateUser(
“select Id, UserName from Users where Id = @p1”,
userID);
Finding the memory leak
The second problem I want to investigate is the continual growth of the memory that is indicating a leak. The ability to see what has changed over time is a very powerful way to find leaks, so I am going to compare the current dump to the first one I took. To do this, I expand the “Select Baseline” dropdown, and choose “Browse…” This allows me to select “iisexpress1.dmp” as my baseline.

Once the baseline finishes analyzing, I have an additional two columns, “Count Diff” and “Total Size Diff” that show me the change between the baseline and the current dump. Since I see a lot of system objects I don’t control in the list, I’ll use the Search box to find all objects in my application’s top level namespace “SampleLeak”. After I search, I see that SampleLeak.Models.User has increased the most in both size, and count (there are additional 10 objects compared to the baseline). This is a good indication that User may be leaking.
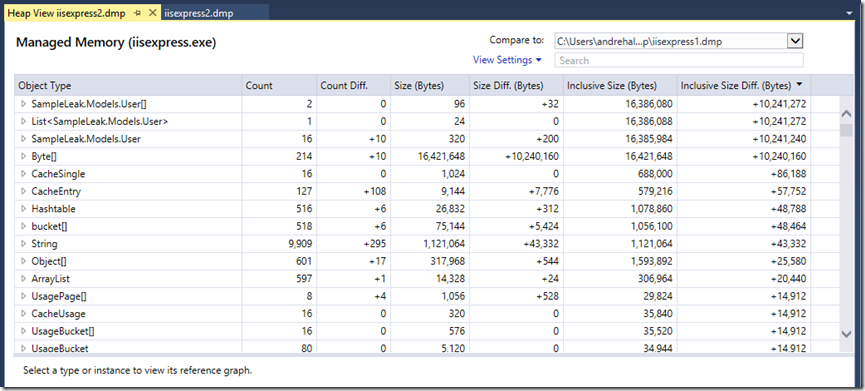
The next thing to do is determine why User objects are not being collected. To do this, I select the SampleLeak.Models.User row in the top table. This will then show me the reference graph for all User objects in the bottom pane. Here I can see that SampleLeak.Models.User[] has added an additional 10 references to User objects (notice the reference count diff matches the count diff of User).
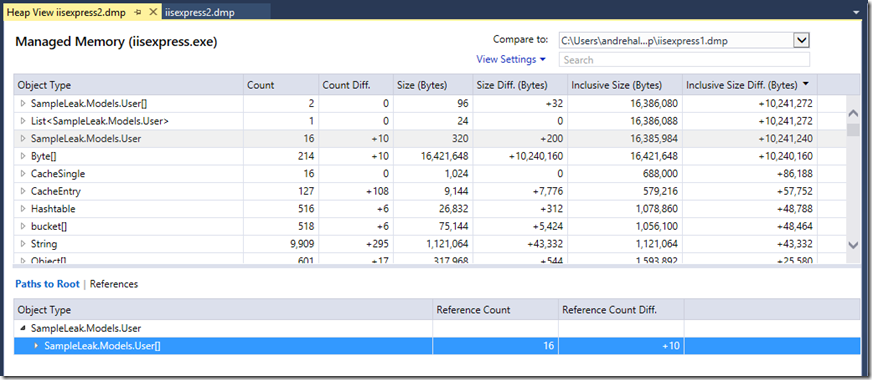
Since I don’t remember explicitly creating a User[] in my code, I’ll expand the reference graph back to the root to figure out what is referencing the User[]. Once I’ve finished expansion, I can see that the User[] is part of a List

Next I’ll go to the UserRepository class I added to the application.
public static class UserRepository
{
//Store a local copy of recent users in memory to prevent extra database queries
static private Listm_userCache = new List ();
public static ListUserCache { get { return m_userCache; } } public static User GetUser(string userID)
{//Retrieve the user’s database record
User user = MockDatabase.SelectOrCreateUser(
“select Id, UserName from Users where Id = @p1”,
userID);//Add the user to cache before returning
m_userCache.Add(user);
return user;
}
}
Note, at this point determining the right fix usually requires an understanding of how the application works. In the case of my sample application, when a user loads the Home page, the page’s controller queries the UserRepository for the user’s database record. If the user does not have an existing record a new one is created and returned to the controller. In my UserRepository I have created a static List
Coming back to the investigation, a review of the logic in my GetUser() method reveals that the problem is I’m not checking the cache before querying the database, so on every page load I’m creating a new User object and adding it to the cache. To fix this problem I need to check the cache before querying the database.
public static User GetUser(string userID)
{
//Check to see if the user is in the local cache
var cachedUser = from user in m_userCache
where user.Id == userID
select user;
if (cachedUser.Count() > 0)
{
return cachedUser.FirstOrDefault();
}
else
{
//User is not in the local cache, retrieve user from the database
User user = MockDatabase.SelectOrCreateUser(
“select * from Users where Id = @p1”,
userID);
//Add the user to cache before returning
m_userCache.Add(user);
return user;
}
}
Validating the fix
Once I make these changes I want to verify that I have correctly fixed the problem. In order to do this, I’ll launch the modified application again and after 20 page refreshes, Performance Monitor shows me only a minimal increase in memory (some variation is to be expected as garbage builds up until it is collected).
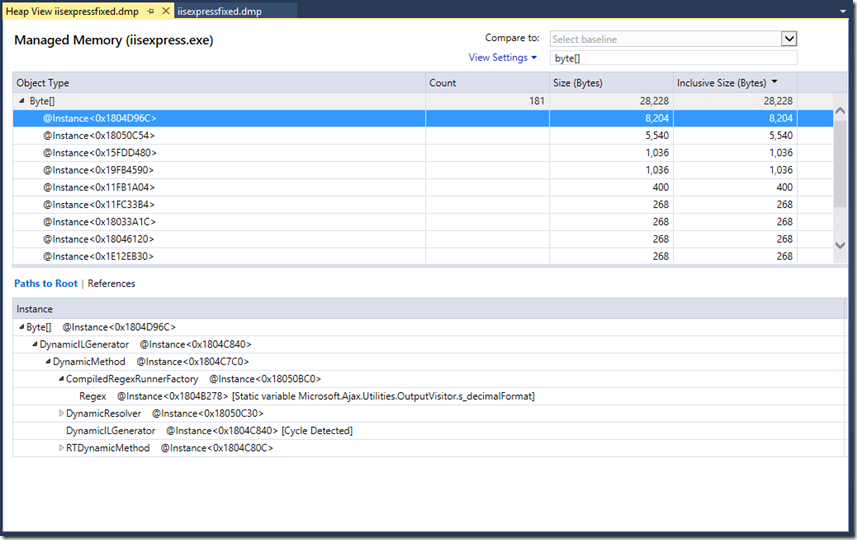
Just to definitely validate the fixes, I’ll capture one more dump and a look at it shows me that Byte[] is no longer the object type taking up the most memory. When I do expand Byte[] I can see that the largest instance is much smaller than the previous 1 MB instances, and it is not being referenced by User. Searching for User shows me one instance in memory rather than 20, so I am confident I have fixed both of these issues.
In Closing
We walked through a simple example that showed how to use Visual Studio 2013 to diagnose memory problems using dump files with heap. While the example was simple, hopefully you can see how this can be applied to memory problems you have with your applications in production. So if you find yourself in a scenario where you need to be using less memory, or you suspect there is a memory leak give Visual Studio 2013 Ultimate a try. Feel free to download the sample project used in this blog post and try it for yourself. It is recommended that you continue by reading part 2 of this post covering additional features.
If you have any comments/questions I’d love to hear them in the comments below or in our MSDN forum.
Using the example in this post
If you would like to try the sample I showed in this post do the following:
- Download the attached SampleLeakFiles.zip file and extract the contents
- In Visual Studio 2013 Create a new C# ASP.NET MVC project and name it “SampleLeak” (make sure to use the new Visual Studio 2013 One ASP.NET template)
- Replace the contents of the generated “ControllersHomeController.cs” with the copy from the .zip
- Add the “User.cs” included in this .zip to the “Models” folder
- Add the included UserRepository.cs and MockDatabase.cs to the project
Your SampleLeak MVC app will now match the app I used to create this blog post

0 comments