Ever since the initial release of reporting with Power BI against Git and Team Foundation Version Control, the single consistent question was “When will I get the ability to report on work items?”
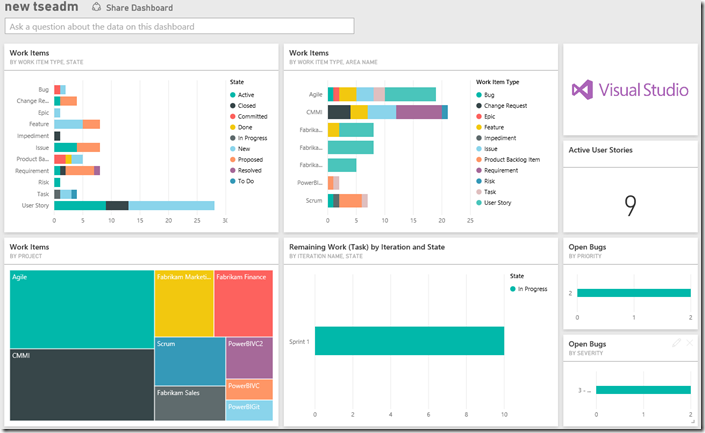
The answer is “Today”. Shown below is a partial view of the new updated dashboard.

The first question that I’ve been asked is “What’s included?” So let me share some of our plans around what we’ve delivered and what we’re hard at work on.
In this release, we support the current state of work items only. That means you can’t do a burndown yet and you can’t do rollup yet.
What can you do with this first release of work item reporting?
- Report across team projects
- Velocity charts
- Filtering by area, iteration, tags and any other fields
- Add some advanced metrics such as median days in state and 95th percentile days in state – we’ll be adding more of these as we go
The next question is always “What are we enabling next?” We’re currently hard at work on the history and rollup capabilities and will be releasing these next (concurrently). These should be available by the end of August. After that comes Kanban data.
The next question we invariably get is **“When will this be available for on-premises use?” **
However, the answer to this is still TBD because Power BI does not support our on-premises installation as of today. We are still working on our plans in this area.
How to use the new model
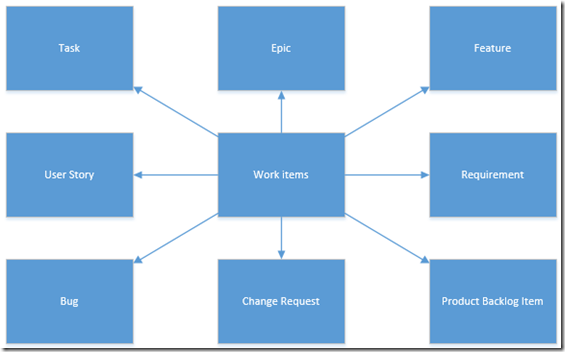
The structure of the work item dimensions are shown here (this is representative – there are other dimensions such as Issue and Risk which aren’t shown here):

This model provides core work items dimension and then related dimensions for each of the individual work item types. The core work items table contains the System.* fields and some measures such as Work Items (which is the count of work items). The individual work item dimensions contain fields that are specific to those work items. For example, you’ll find the Remaining and Completed Work measures in the Task and Bug dimensions.
Each work item dimension also has its own count. For example, in the Bugs dimension there is a Bugs measure which is the count of bugs. To get the count of bugs for an iteration you could do either of the following:
- Drag iteration onto the report page
- Click the Bug measure in the bugs table
OR
- Drag iteration onto the report page
- Click the Work Items measure in the Work Items dimension
- Filter the Work Item type by bug
Either will work equally well. A major reason for using the work item table is to get breakdowns by work item type or assigned to across work item types.
Providing dimensions by work item type yield measures which relate specifically to that dimension. Take the Issues dimension. Issues, by default have a due date field. There are two numeric values that we support – Days Past Due and Days Until Due which calculate off of this date.
Will this model change going forward?
Yes. The data model for work items will change in future releases because of certain technical requirements we have however, the basic structure will remain the same.
Getting Started
To get started, head over to https://msit.powerbi.com/groups/me/getdata/services/visual-studio-online and start pulling data! Sign up for a free account if you don’t have one. Documentation on getting started can be found here.
Please provide any feedback in the comments here or on http://visualstudio.uservoice.com/forums/121579-visual-studio/category/30925-team-foundation-server-visual-studio-online.


0 comments