This post provides a quick-start guide to using SonarQube to analyze .NET managed code. It covers installing SonarQube locally, running your first analysis using MSBuild, and using some popular third-party analyzers. It also describes how to use the new Visual Studio Online (VSO) and Team Foundation Server (TFS) Build tasks to perform analysis as part of a VSO or TFS build.
Introduction
SonarQube is an open source product, produced by SonarSource SA, which consists in a set of static analyzers (for many languages), a data mart, and a portal that enables you to manage your technical debt. SonarSource and the community provide additional analyzers (free or commercial) that can be added to a SonarQube installation as plug-ins. SonarSource and Microsoft have been working to integrate SonarQube with MSBuild and TFS for some time and, since August 2015, there is a wide range of possibilities for analyzing the technical debt in your .NET projects.
This post aims to help you discover the possibilities for analyzing your technical debt using the MSBuild.SonarQube.Runner 1.0.1**, which is at the core of the integration of SonarQube with MSBuild.
In this post, I’ll show you how you can:
· Install a SonarQube server locally on Windows. It’s quite easy to set up SonarQube on a Windows computer for trial or demo purposes, though I’ll also provide pointers to setting up a production environment.
· Analyze a project locally with MSBuild. In this section, I’ll show how you use the SonarQube.MSBuild.Runner in your builds
· Incorporate other code analyzers that run locally. For example, you can get extra coverage for technical debt by using analyzers such as StyleCop *and ReSharper.*
· Incorporate other code analyzers in VSO or TFS. In a previous post, I showed how you can analyze your .NET projects with the SonarQube Build vNext analysis tasks in VSO or TFS. Here, I’ll show you how you can, in addition, run third-party analyzers with Build vNext.
Installing a SonarQube server on a local Windows computer
In the following sections of this post, I’ll be using SonarQube server installed on my local computer. To do this I installed Java, downloaded SonarQube from the SonarSource portal, and unzipped it. I’m using the default embedded database (H2), which is not designed to be used for production, and I’m running SonarQube as a Windows service. To set it up, I followed these instructions on GitHub.
Why would you want to use the default, non-production installation? This might be because, as a consultant, you are working with your customer’s code on your own computer, or on one of their computers, but you don’t want to set up an integrated build. Alternatively, it might be that you want to start playing with SonarQube analysis for .NET and learn about it, before using it in production
If you want to do something more serious, such as for production use, you can install another database such as SQL Server. The Visual Studio ALM Rangers provide guidance on how to do that. This guidance was converted to a GitHub repository (sonar-.net-documentation), and is also available as a PDF file.
Next, I signed in as an administrator to the SonarQube server (the default username and password is admin / admin), went to the Update Center (Settings | System | Update Center), and installed the SonarQube C# Plug-in. This plug-in tells SonarQube how to analyze C# code. The SonarQube Update Center downloads the plug-in from the Internet and installs it in my SonarQube server.
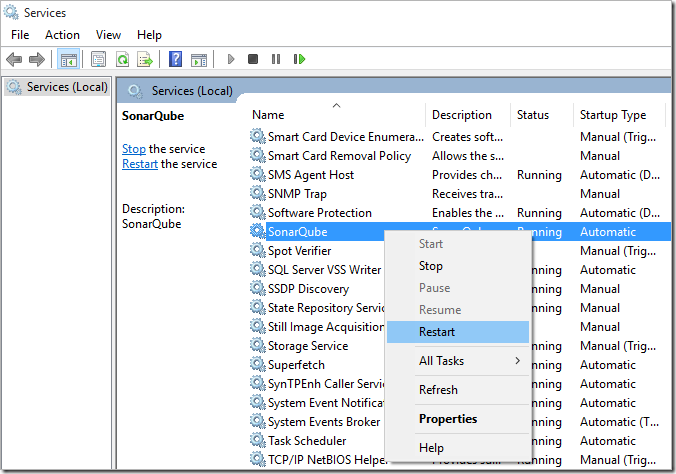
SonarQube must be restarted after installing or updating a plugin. As I’m running SonarQube as a Windows service, I did this by selecting Restart in the Local Services console.
Installing the MSBuild.SonarQube.Runner scanner
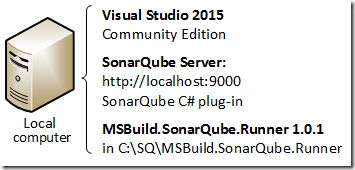
I downloaded the MSBuild.SonarQube.Runner 1.0.1 scanner, which I unzipped on my computer into the folder C:SqMSBuild.SonarQube.Runner-1.0.1. Remember, my configuration here is a single computer that hosts Visual Studio, the SonarQube Server, and the MSBuild.SonarQube.Runner 1.0.1.
Analyzing a project locally with the MSBuild.SonarQube.Runner
The first experiment I’m going to carry out is to run the MSBuild.SonarQube.Runner locally. Visual Studio 2015 Community is installed on my computer. What I need to do is:
-
Open a **Developer Command Prompt for VS2015 **from the Start menu.
-
Navigate to the folder containing the project I want to analyze.
-
Run the following commands:
path=%path%;C:SqMSBuild.SonarQube.Runner-1.0.1
MSBuild.SonarQube.Runner begin /n:Backlogmaps /v:1.0 /k:blm
Msbuild
MSBuild.SonarQube.Runner end
The first of the commands in step 3 just sets the path to include the folder where I unzipped the MSBuild.SonarQube.Runner (and only for the duration of the command window). Note that, here, I’ve chosen to set the path in the command prompt. I could have changed the environment variables permanently in the Advanced tab of the System Properties dialog (Control Panel | System | Advanced system settings).
The second command downloads the quality profile to be used for my project, as well as some binaries related to the .NET analysis, from the SonarQube server installed locally on my computer (I have not changed any configuration settings).
The third command simply runs MSBuild on my folder (I have only one solution).
The fourth command completes the SonarQube analysis, and sends the results to the SonarQube server.
Here are the last few lines of the console output:

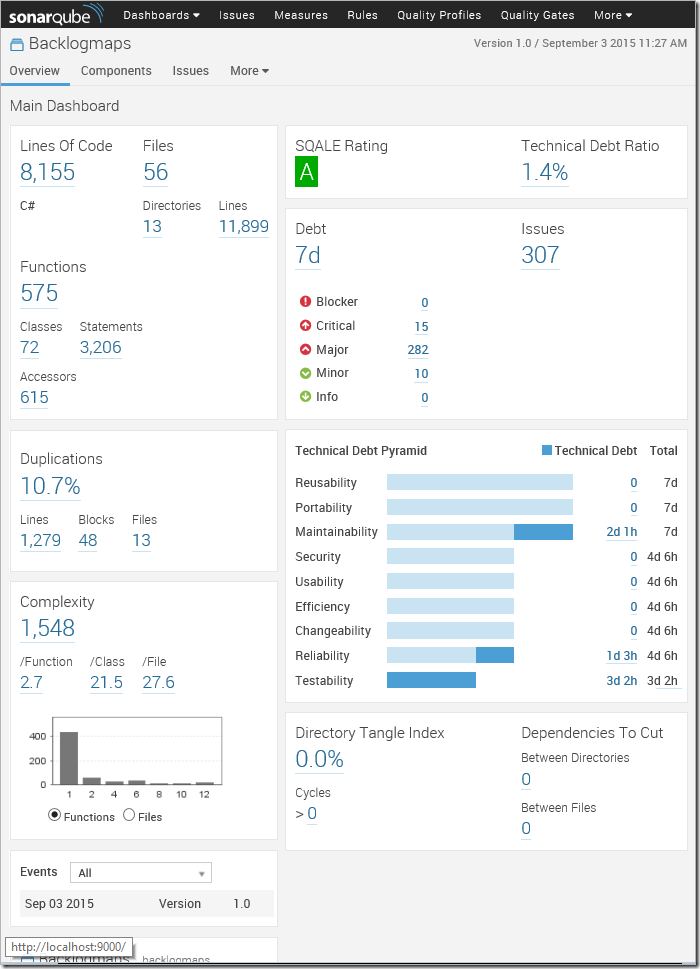
Now I open the URL http://localhost:9000/dashboard/index/backlogmaps (as indicated in the analysis results shown above) in my browser, and I get a first view of my project.
Passing additional settings; for example, to change the analysis verbosity
The output produced by version 1.0 of the MSBuild.SonarQube.Runner was very verbose, so in version 1.0.1 we reduced the level of detail produced in normal operation. If you want to enable verbose log files, you can do it by settings the sonar.verbose property to true. Here is how you do it compared to the commands you saw earlier:
path=%path%;C:SqMSBuild.SonarQube.Runner-1.0.1
MSBuild.SonarQube.Runner begin /d:sonar.verbose=true /v:1.0 /k:blm /n:Backlogmaps
Msbuild
MSBuild.SonarQube.Runner end
As a result, the analysis displays a lot more information – you can see the INFO and DEBUG lines in this screenshot.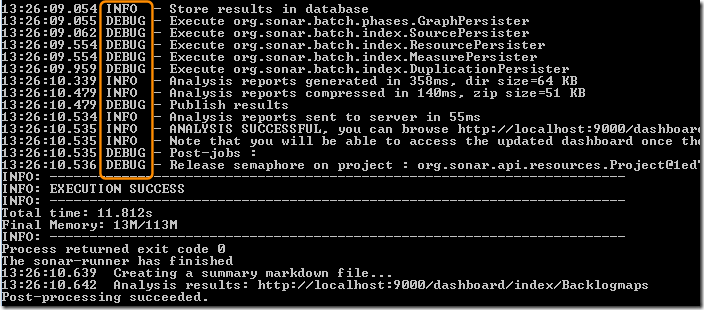
Note that the /d: option is used to set any variable that SonarQube or its plug-ins understands. I’ll be using it later in this post when performing analysis using third-party plug-ins.
Executing third-party analyzers locally
Since we released the MSBuild.SonarQube.Runner, we received several questions related to running third-party analyzers such as StyleCop, ReSharper, or NDepend. The NDepend plug-in is not officially available yet, but I’ll explain in this section how you can run StyleCop and ReSharper analysis and send the results to SonarQube.
StyleCop
If you want to add StyleCop to your analysis, you’ll need to:
· Install StyleCop on your build computer
· Install the SonarQube StyleCop plug-in
· Restart the SonarQube server
· Add StyleCop rules to the quality profile
Installing StyleCop
It’s really easy to install StyleCop:
-
Download the StyleCop MSI from https://stylecop.codeplex.com/.
-
Run the MSI to install StyleCop on your build computer.
Currently SonarQube supports StyleCop 4.7. StyleCop installed as a NuGet package is not yet supported, though we have raised a SonarQube suggestion for this.
Installing the SonarQube StyleCop plug-in
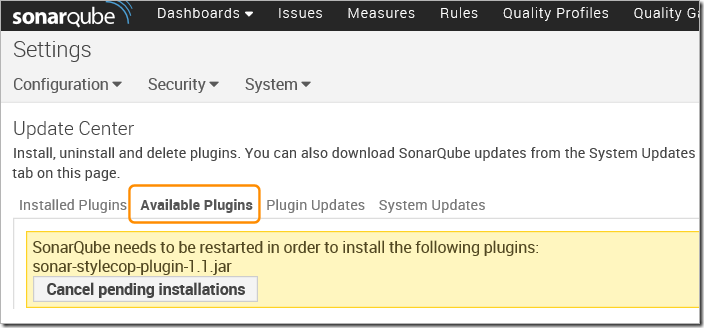
To install the SonarQube StyleCop plug-in, I chose the Login link at the top right of the SonarQube server web page, and signed in as the SonarQube server administrator (admin / admin by default). Then I navigated to Settings | System | Update Center, and opened the Available Plug-ins **tab. In the **External Analyzers section, I located “Style Cop” and installed it. The link automatically downloads the plug-in from the Internet and installs it in my SonarQube server.
Restarting the SonarQube server
Next, I restarted the SonarQube server from the **Local Services **window, as shown earlier.
Adding the StyleCop rules to the quality profile
SonarQube has the notion of Quality Profiles. A quality profile is essentially a mechanism for grouping a set of rules. Every SonarQube project has an associated quality profile per analyzed language that determines the rules that are run against that project for this language.
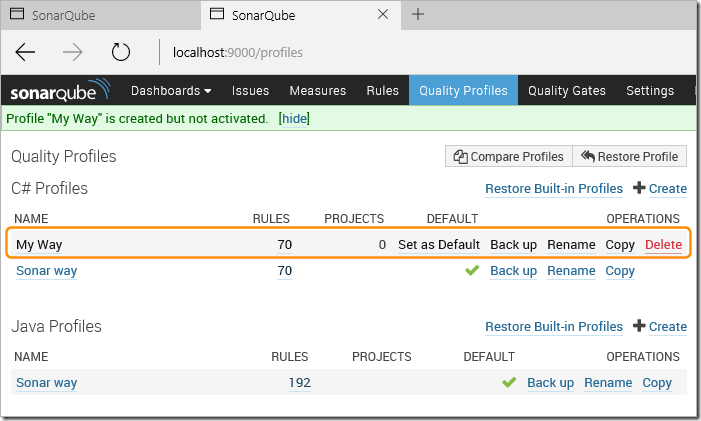
After installing the StyleCop plug-in and restarting the server, SonarQube will be aware of StyleCop rules. However, these won’t yet be activated in the quality profile associated with your project – you must activate them yourself. I’m going to create my own quality profile named My Way by cloning the default Sonar Way profile, and add rules for the StyleCop plug-ins I’ve installed.
-
Sign into the SonarQube server as an administrator (you must be an administrator to update the quality profile).
-
Choose Quality Profiles **and select the default **Sonar Way profile.
-
Choose Copy, and create a new quality profile named My Way.
-
Choose **Set as Default **in the “My Way” entry to set it as the default for C# projects (I could have associated it with only my project instead).
-
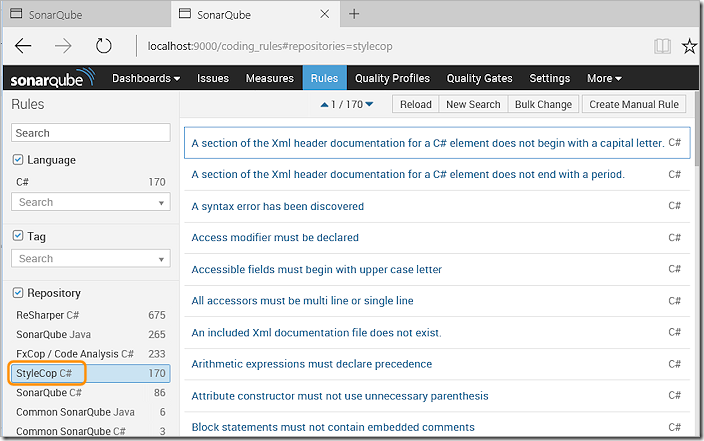
Choose Rules **in the top navigation toolbar and then set the **Repository textbox in the left-hand column
-
Select **StyleCop **in the Repository list to see the list of rules.
-
Select all the StyleCop rules (when using a mouse you can click on the first rule, scroll to the end, and Shift-click the last one).
-
Choose Bulk Change and then choose Activate In. From the drop-down list, choose the **My Way **profile.

After a few seconds, SonarQube tells you that rules were added to the **My Way **quality profile.
Re-running the analysis
Just as before, I run the commands:
path=%path%;C:SqMSBuild.SonarQube.Runner-1.0.1
MSBuild.SonarQube.Runner begin /n:Backlogmaps /v:1.0 /k:blm
Msbuild
MSBuild.SonarQube.Runner end
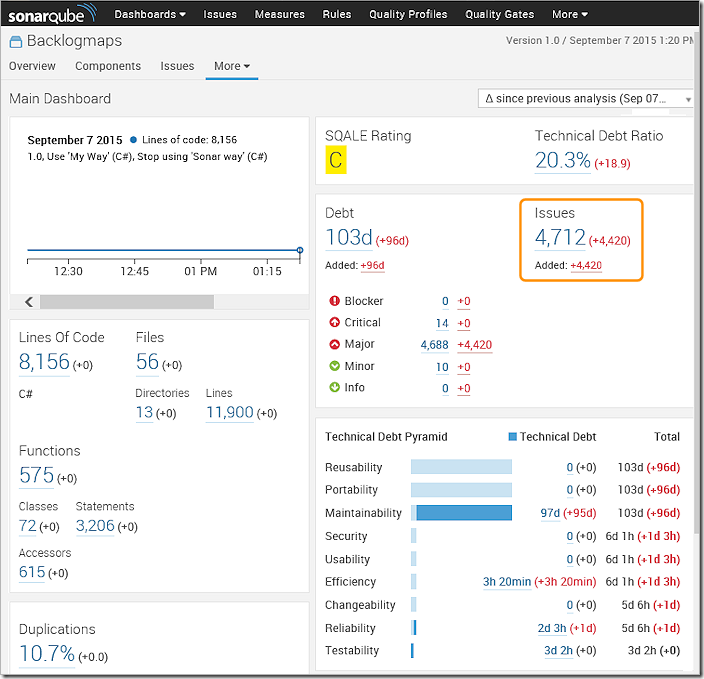
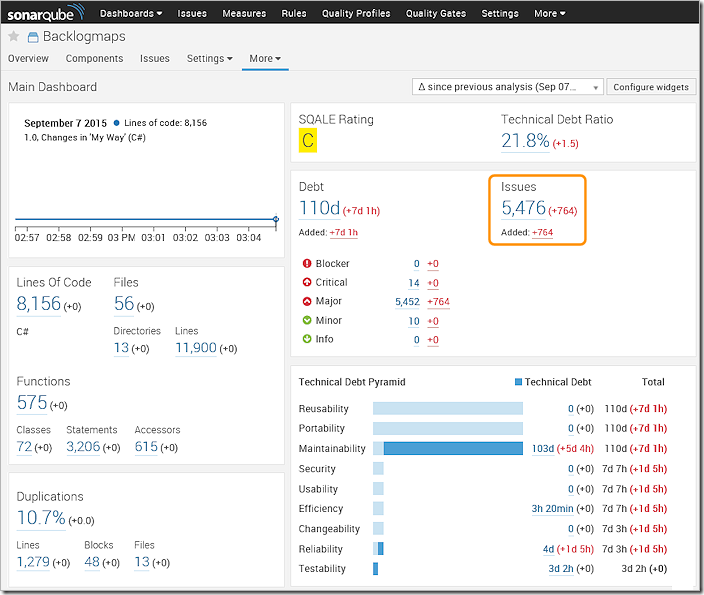
The result, however, is very different. Now I get 4,420 additional issues (I was a little ruthless in activating all the StyleCop rules J).
StyleCop: conclusion
Adding StyleCop to your analysis is quite easy. You just install StyleCop on your build/analysis computer, install the StyleCop plug-in, activate the StyleCop rules in the quality profile for your project, and re-run your analysis.
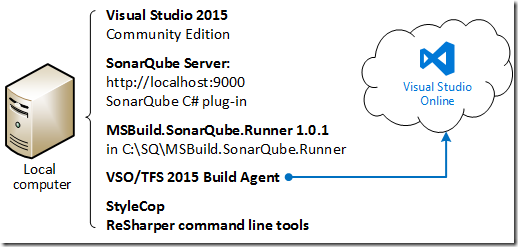
Note that the fact that you need to install StyleCop on the build computer means that you won’t be able to run it with a Hosted build agent in Visual Studio Online. You will need to set up a private build agent. We’ll do that in the last section of this post. But, before then, let’s see how to perform an analysis with the ReSharper command line tool.
ReSharper
To perform an analysis with ReSharper, you carry out a very similar set of steps as you did for StyleCop. The main difference is that, in this case, you must add parameters for the analysis. The basic steps are:
· Install ReSharper on your build computer
· Install the SonarQube ReSharper plug-in
· Restart the SonarQube server
· Add ReSharper rules to the quality profile
Installing ReSharper
Download the JetBrains ReSharper Command Line Tools and install it on your local computer. This is a zip file, which I unzipped into the folder:
C:Program Files (x86)JetBrains.ReSharper.CommandLineTools.9.1.20150724.155556
Installing the SonarQube ReSharper plug-in
Using the Update Center on my SonarQube server (Settings | System | Update Center) as an administrator, I added the ReSharper plug-in from the **Available Plug-ins **tab. This automatically downloads the plug-in from the Internet and installs it in my SonarQube server.
Restarting the SonarQube server
Next, I restarted the SonarQube server from the **Local Services **window, as shown earlier.
Adding the ReSharper rules to the quality profile
After signing in to the SonarQube server as an administrator, I go to the Rules tab, select the ReSharper rules repository, select all the rules I want to include, and “bulk add” these rules to the quality profile. See the earlier section about StyleCop for more details.
Re-running the analysis
For the analysis itself, things are different. I need to run the ReSharper command line tool after the MsBuild step:
path=%path%;C:SqMSBuild.SonarQube.Runner-1.0.1
MSBuild.SonarQube.Runner begin /n:Backlogmaps /v:1.0 /k:blm /d:sonar.resharper.solutionFile=%UserProfile%SourceReposBacklogmapsStoryMaps.sln /d:sonar.resharper.cs.reportPath=c:tempReSharperResult.xml
Msbuild
“C:Program Files (x86)JetBrains.ReSharper.CommandLineTools.9.1.20150724.155556inspectcode.exe” StoryMaps.sln /o=C:tempReSharperResult.xml
MSBuild.SonarQube.Runner end
Note that I run ReSharper only in the fourth line, after the build, and provide the path and name of a result file. However, I still need to tell the MSBuild.SonarQube.Runner about the ReSharper report path before the build starts. The last step (calling MSBuild.SonarQube.Runner with the end verb) does not accept parameters. This is because some parameters must be known from beginning in order to send a request to the server containing the appropriate information.
When we designed the MSBuild.SonarQube.Runner, we thought it would be confusing if you had to figure out which details are required in the begin step and which are required in the end step.
Now, in the SonarQube project dashboard, I can see that the ReSharper rules have added more issues.
ReSharper: conclusion
Adding ReSharper to your analysis is a little more complicated than when using StyleCop because it requires parameters. You install ReSharper on your build/analysis computer, install the ReSharper plug-in, activate the ReSharper rules in the quality profile for your project, update the build to include the required parameters by using the **/d: **parameter option on the command line of the MSBuild.SonarQube.Runner, and then re-run your analysis.
Note that, as with the StyleCop example, the fact that you need to install ReSharper on the build computer means that you won’t be able to run it with a Hosted build in Visual Studio Online. You will need to set up a private build agent, as shown in the next section of this post.
Executing third-party analyzers from VSO or TFS
Now that you understand how the MSBuild.SonarQube.Runner works, I’ll use it with Visual Studio Online (VSO) by adding the commands you saw in earlier examples to an example of a nightly build that runs in VSO. For this, I’m going to use the Build tasks for SonarQube analysis, which we released three weeks ago. However, as I already mentioned, we cannot use the Hosted build agent if we want to run StyleCop or ReSharper because they will not be installed on the hosted agent computer. Therefore, I’ll need to use a private build agent.
Setting up a private build agent on my computer
As I am a Build Administrator and Agent Pool Administrator in my VSO account, I was able to install the agent on my Windows computer by following these instructions. Alternatively, use the “get started” link in the BUILD tab in Visual Studio Online and choose the Deploy Windows agents link in the page that opens.

I followed the instructions to deploy the agent manually on my local computer because I did not want to install TFS on this computer.
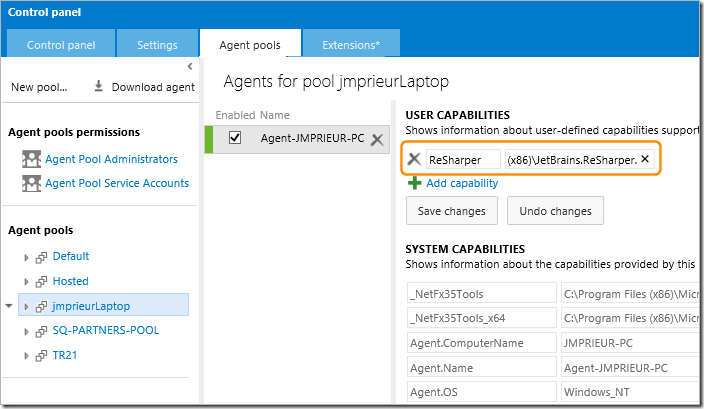
This was simple! I created an agent pool named JmprieurLaptop, and used the name Agent-JMPRIEUR-PC **for my agent. Then I added a capability to my agent (using the **USER CAPABILITIES page) to indicate that this agent knows about ReSharper. This allows the build system to select the appropriate agent at runtime.
Creating a build definition in Visual Studio Online
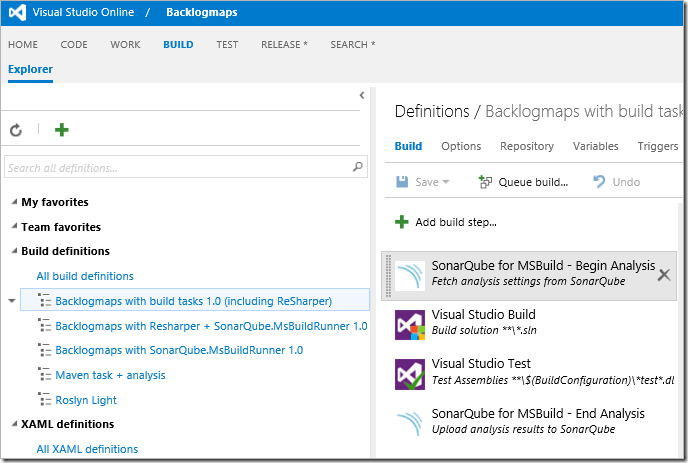
Next, I created a new build definition that includes a Visual Studio Build task and a Visual Studio Test task. Then I then inserted a **SonarQube for MSBuild – Begin Analysis **task as the first step and a **SonarQube for MSBuild – End Analysis **task as the last step.
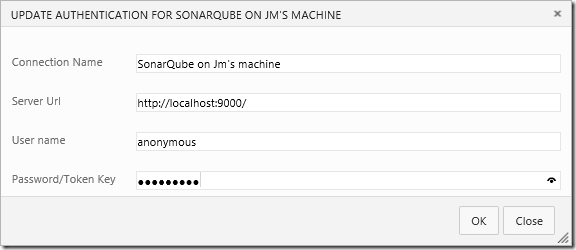
I need a service endpoint for the connection to SonarQube, so I went to the VSO Control Panel and created one named SonarQube on Jm’s machine. I used anonymous / anonymous as a user-name and password. These parameters cannot be empty, but the actual values don’t matter because I have not secured my SonarQube installation.
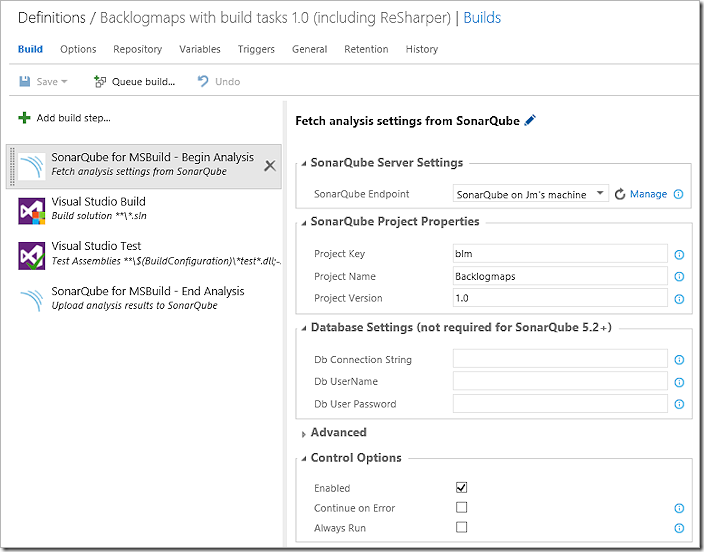
Now I can use this endpoint in the parameters of the **SonarQube for MSBuild – Begin Analysis **step, where I also provided the same parameters as I used in MSBuild. Note that I did not need to provide any database parameter because I’m using a simple local installation of SonarQube.
Adding a task to configure and invoke ReSharper
To invoke ReSharper during the build, I need to do two things:
· Add parameters to the **SonarQube for MSBuild – Begin Analysis **step to configure the build to use ReSharper.
· Add a Command Line task step after the Visual Studio Test step to invoke the ReSharper InspectCode executable.
For the first of these, I can use the environment variables available in the build steps. You saw some of these environment variables in the USER CAPABILITIES list when I configured the build agent. The solution file will be $(Agent.BuildDirectory)$(Build.Repository.Name)StoryMaps.sln. For the output report, I can continue to use C:tempReSharperResult.xml.
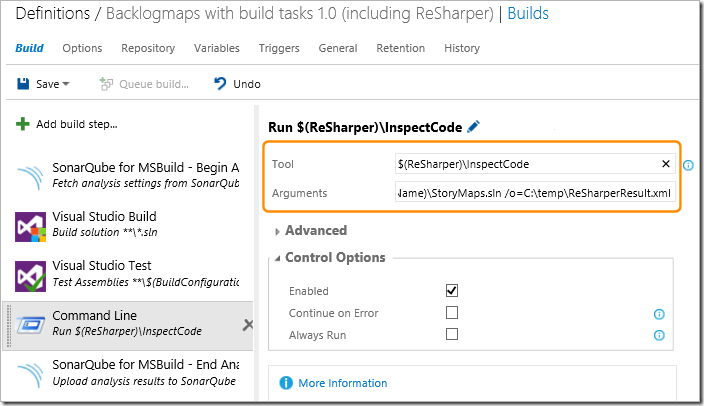
So, I inserted a Command Line task step using the parameters:
· Tool: $(ReSharper)InspectCode. Notice that I’m using the ReSharper user capability that I added to the agent when I installed it.
· Arguments: $(Agent.BuildDirectory)$(Build.Repository.Name)StoryMaps.sln /o=C:tempReSharperResult.xml
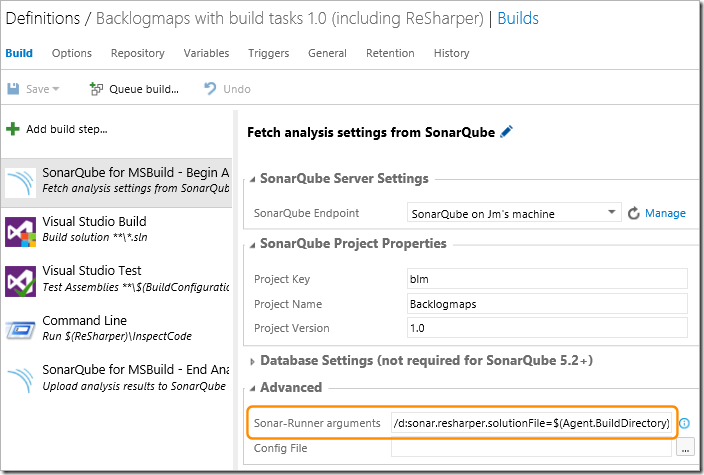
Now, for the second change required to enable ReSharper, I need to pass the corresponding arguments (the solution file path and the output report path) to the MSBuild.SonarQube.Runner. For this, I used the **Sonar-Runner arguments **parameter. I pass as arguments the values:
/d:sonar.resharper.solutionFile=$(Agent.BuildDirectory)$(Build.Repository.Name)StoryMaps.sln
and
/d:sonar.resharper.cs.reportPath=c:tempReSharperResult.xml
Specifying the appropriate build agent to be used for the build
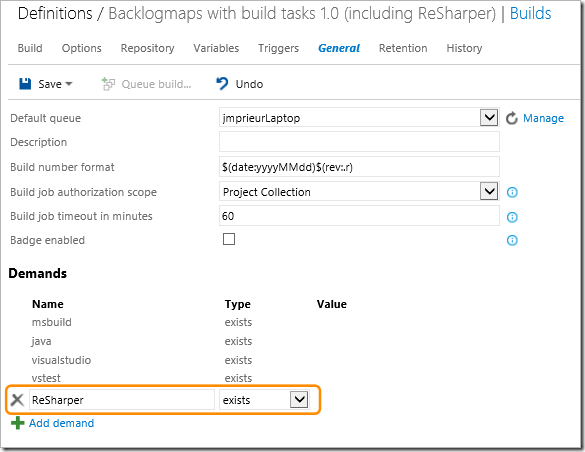
Finally, I used the General tab of my build definition to edit the list of Demands for the build agent so that it will use only the agent that has a user capability named ReSharper – recall that I added this to the list of user capabilities for the agent when I installed and configured it earlier.
Queuing the build manually
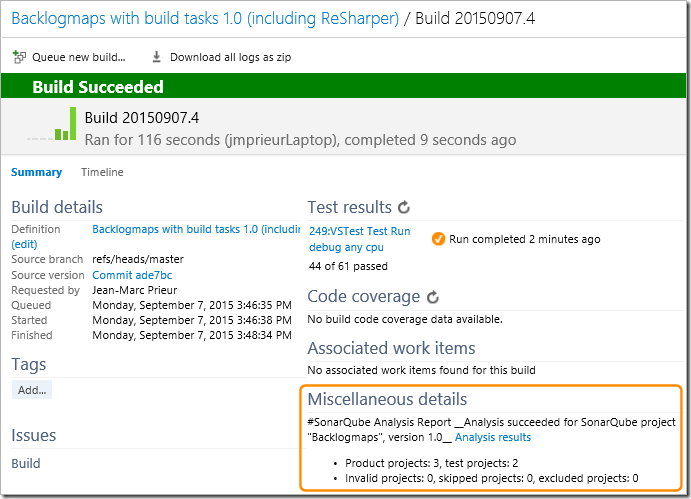
Now I queued the build manually, and it worked perfectly. Notice that I now get a simple summary of the SonarQube analysis in the **Miscellaneous details **section of the build result.
Conclusion
In this post, you’ve seen how you can:
· Install a SonarQube server locally on Windows. It’s quite easy to set up SonarQube on a Windows computer for trial or demo purposes, though I’ve also provide pointers to setting up a production environment.
· Analyze a project locally with MSBuild. In this section, I showed how you use the SonarQube.MSBuild.Runner in your builds.
· Incorporate other code analyzers that run locally. For example, you can get extra coverage for technical debt by using analyzers such as StyleCop and ReSharper.
· Incorporate other code analyzers in VSO or TFS. You can analyze projects with third-party analyzers using the SonarQube Build vNext analysis tasks in VSO or TFS.
We look forward to hearing from you. Please send us your feedback by asking some questions on StackOverflow or directly by reporting any bugs you find on the SonarQube Google Group. You can also submit suggestions for new features, for example, on User Voice.

Does this work with DotNet Core projects? I cannot find any sources that directly address this point.