This blog post introduces the updates to the CPU Usage tool in Visual Studio 2015 Update 1. First we will define and introduce the CPU Usage tool and then we’ll go over some of its features.
If you would like to provide feedback about your profiling experiences, we’d love to hear from you: take this short survey or drop us an e-mail.
Overview
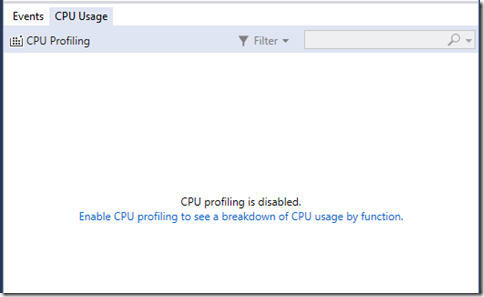
Visual Studio 2015 introduced the Diagnostic Tools Window** **which makes it easy for you to detect issues early while you are debugging. With VS2015 RTM, you can watch the CPU utilization graph to see if there is any CPU-intensive code running as you set breakpoints and step through code. If you open the CPU Usage tab, you see a message redirecting you to use the CPU Usage tool without the debugger for more detailed information.
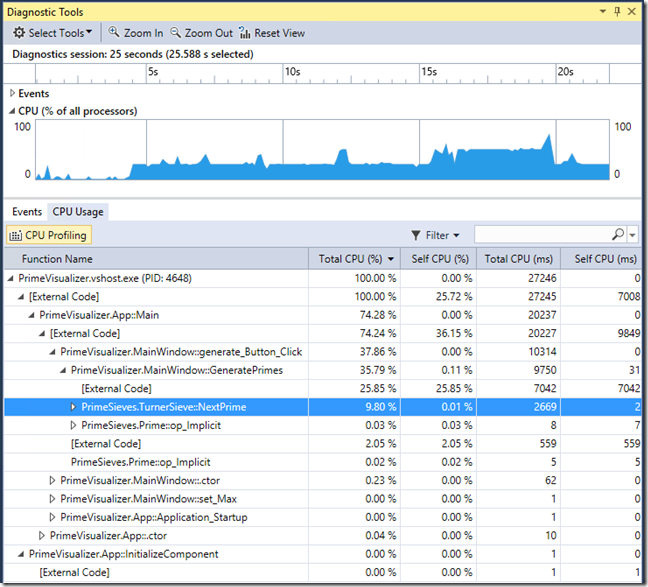
Now VS2015 Update 1 takes the next step and makes it easy for you to do full CPU profiling without stopping your debug session. Here is a screenshot of the new CPU Usage tab:

This exciting new capability allows you to quickly and easily see which of your functions were running on the CPU and find the most CPU-heavy code paths in your application. Not only is profiling easier when done as part of the debugging workflow, but it is more powerful: you have control of both the execution of the application as well as the collection of CPU profiling data. You can easily drill into a section of code by hitting a breakpoint, turning profiling on, and then running to the next breakpoint. This takes the guesswork out of CPU profiling, where you normally can’t set breakpoints and have to spend time narrowing down the profiler to the area of interest.
Keep on reading to see it in action!
Using the CPU Usage tool
You can enable CPU Profiling during a debug session by opening the Diagnostic Tools window (Debug -> Show Diagnostic Tools or Ctrl+Alt+F2), switching to the CPU Usage tab, and clicking the CPU Profiling toggle button on the toolbar:

When CPU profiling is enabled, the CPU Usage tool collects a statistical sampling of what code is running on the CPU. You can turn profiling on and off at any time, and the CPU graph will indicate in a darker-blue color which sections of time have data available:

To see the collected data, you need to enter a break state for example by hitting a breakpoint, completing a step, or pressing Break All (the pause icon on the main VS toolbar). Once you are in a break state, the CPU Usage tab displays a call tree showing the per-function breakdown of CPU Usage for the selected range of time. The call tree allows you to explore the CPU Usage of the code paths in your application: functions are grouped by calls; a child function was called by the parent function.

The columns represented in the call tree are as follows:
|
Function Name |
Name of the function present on the CPU |
|
Total CPU (%) |
Total percentage of the CPU’s time spent executing this function and functions it called in the selected time range |
|
Self CPU (%) |
Total percentage of the CPU’s time spent executing this function, but not functions it called in the selected time range |
|
Total CPU (ms) |
The amount of time this function and functions it called were running on the CPU in the selected time range * |
|
Self CPU (ms) |
The amount of time this function, but not functions it called, were running on the CPU in the selected time range * |
|
Modules |
The module(s) of which this function belongs to |
* Can be greater than the total elapsed time shown in PerfTips for a segment of code, as it is a sum of time taken on each individual CPU
Automatic time selection makes analysis a breeze
The Diagnostic Tools window automatically updates the time range selection as you set breakpoints and step. As a result, the contents of the CPU Usage tab update automatically as you debug your code. You can simply look over at the CPU Usage tab to see the most recent information.
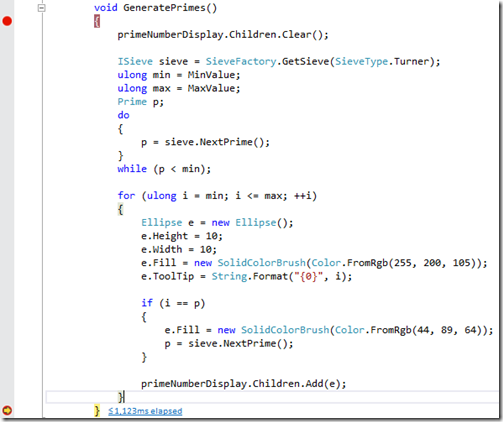
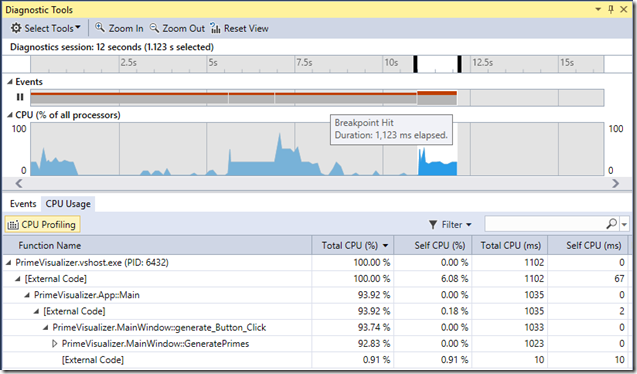
When you run a program between two breakpoints, as seen in the screenshot below, the CPU usage tool shows the CPU usage between the two breakpoints. PerfTips and the Diagnostic Tools window shows that the program was running for 1,123ms of real world end-to-end time during the GeneratePrimes() function, and the Total CPU (ms) column in the CPU Usage tab shows you that 1102ms of this time was running code on the CPU. In this case, the segment of code was CPU intensive; a large difference between Total CPU time and real world time would indicate that the CPU was waiting for I/O or otherwise blocked.


Stepping over a function will expand the time range selection to include the last step, adding that function to the CPU graph and call tree. To set the selection manually you can either click on the Break Events track to select previous ranges of time, or click and drag on the CPU graph with the mouse.
Note that you can only see data if CPU Profiling was enabled for the selected range of time.
A few more details
The data required to generate a call tree is captured by a method called sampling. When sampling, Visual Studio captures which function is running on the CPU and its call stack at a fixed interval, currently once a millisecond. The more samples you have collected, the more accurate the values in the table are.
Profiling the CPU during a debug session does introduce two types of overhead to application performance: overhead introduced by the debugger being attached (e.g. the application’s performance will change dramatically when an exception occurs as execution is paused while the debugger is notified) and overhead from executing a debug build with no compiler optimizations applied. To reduce the impact of debugger overhead, you can run the CPU Tool through Debug -> Start Diagnostic Tools Without Debugging. To reduce the impact of overhead from running a debug build, you can run your application in Release Mode to capture a more accurate profile. However, debugging in Release Mode causes some changes to the debugging experience. In most cases, you will still be able to find performance problems while debugging.
The CPU Usage tool works in any project supported by the Diagnostic Tools window, except for projects running in Windows 7 and projects using ASP.NET 5 on .NET Core.
We want your feedback
We are continuing to invest in easier and more powerful profiling tools in Visual Studio, and we want to hear from you about how profiling tools can make you more successful as a developer. Please fill out this short survey and tell us what we can improve.
Additionally, we welcome any feedback through the Send-a-Smile tool in Visual Studio, or by voting on feature requests in the Diagnostics section of UserVoice.

0 comments