In this post, I will show you how to use the Performance and Diagnostics hub tools on phone.
- First we’ll create a sample Phone C# XAML app and bring up the Diagnostics hub Launch Page to see the list of available tools.
- Next we will profile this app on a Windows Phone device and look at the performance report.
- Finally, we’ll look at the profiling options for Silverlight apps
You will need to have Visual Studio Update 2 RC for this walkthrough.
Creating the Sample
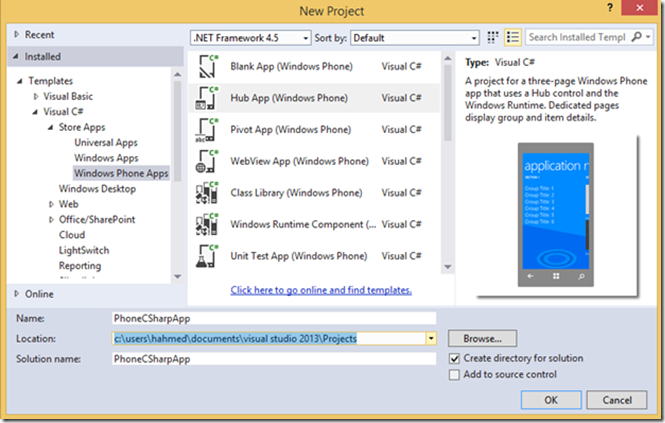
To illustrate how to use these tools I’ll start by creating a Windows Phone app from Hub app template.
I will not add any additional code to this app since I want to show that the tools work for phone and not troubleshoot any specific issue here. You can view our blog posts on tools if you want to see examples of using the tools to troubleshoot performance problems.
Profiling the app
Before I start my app, I need to specify values for Target, Mode and Architecture correctly. I choose Device target, Release mode and ARM configuration. In case you don’t see the configuration option, you can get to it by clicking on the circled drop down and selecting Configuration Manager.
I choose Device rather than one of the available emulators since an emulator’s graphics and IO characteristics are different from a real device. We recommend that you always use a physical device for performance testing.

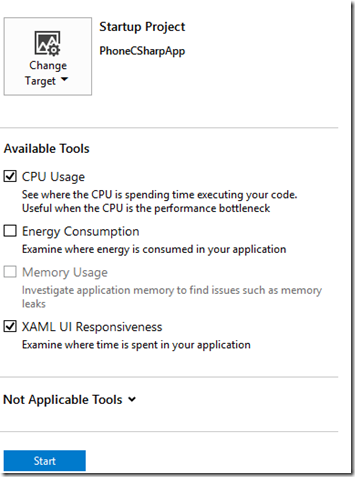
Then I bring up the Performance and Diagnostics Hub Launch Page by either using Debug Menu->Performance and Diagnostics Hub or Alt+F2 shortcut key. You can see that the set of tools which were available for Windows Store apps are also available here. The only difference is that we don’t support profiling of Installed and running apps on Phone.

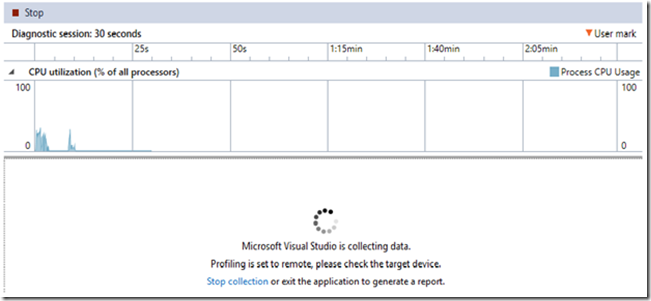
I am interested in measuring the responsiveness of my app so I select CPU Usage tool and XAML UI Responsiveness tool and hit the Start button. Please note that in order to use Energy Consumption and Memory Usage tools on Phone Device, you will have to install Developer Power Tools update pack from Tools->Windows Phone 8.1-> Developer Power Tools. I do a few clicks on the launched app and as I do these clicks, I can see the CPU activity going up in the live graph

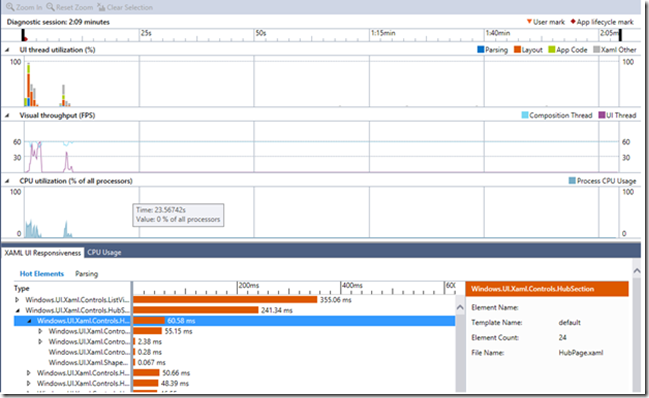
I then hit the Stop Collection link above and get the following report which contains CPU consumption and Visual throughput data for my app. If you are interested in learning more about the use of these tools, you can view our past blog posts about CPU Usage and XAML UI Responsiveness tools and how to combine them

What about Silverlight apps for Phone?
Performance and Diagnostics hub does not support Silverlight Phone apps. You will have to use the existing profiling tools for Phone Silverlight apps. These tools can be accessed from the Debug Menu->Start Windows Phone Application Analysis or Alt+F1 shortcut key.
Let us know what you think!
We are excited to enable our tools for Windows Phone apps. You can expect the same set of tools which you use for Windows Store apps to work for Windows Phone apps also.
If there’s something that would better help you to diagnose your performance problems, whether it’s a new tool or improvements to existing ones, send us feedback on our MSDN Forum (if you run into issues using the tools), or using Send-a-Smile (if you have feedback and/or suggestions) from within Visual Studio or vote for new feature ideas at User Voice.
Update: for in-depth demos of Windows Phone Profiling, check out the video recordings of the Build 2014 talks on diagnosing XAML apps and JavaScript apps on Windows Phone. The profiling content is in the second half of each talk.


0 comments