This blog post will give an overview of the features of the new CPU Usage tool in Visual Studio 2013 Update 2, and then walk through a specific example of how to use the CPU Usage tool to understand what functions are using the CPU so that you can prioritize your time optimizing the functions that will improve your performance the most.
Overview
It can be difficult to know where to start when you want to make your code run faster. In many cases the CPU is the bottleneck when performance problems arise, and you can often start your performance investigation by looking at what code the CPU is executing. You can use the CPU Usage tool in the Performance and Diagnostics hub to see where the CPU is spending time executing C++, C#/VB, and JavaScript code. The tool works on Desktop apps (including console and WPF apps) and Windows Store apps. It can be combined with other tools in the Performance and Diagnostics hub and offers a live CPU graph during collection, fast time range selection, thread filtering, and Just-My-Code.
To use the CPU Usage tool, simply go Debug -> Performance and Diagnostics to open the Performance and Diagnostics hub. Select CPU Usage from the list of available tools and click Start.
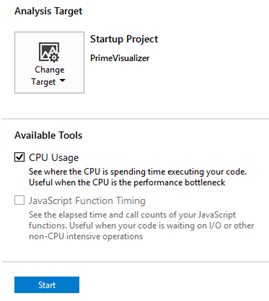
Once your app starts the CPU Usage tool collects a low-overhead profile of the CPU and displays a live graph showing how much of the CPU is being used by your app.
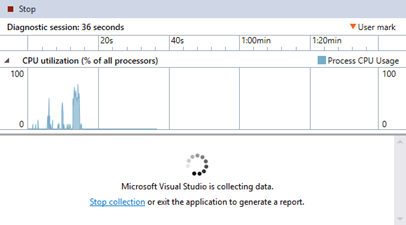
Once you have collected data for the performance issue, go back to Visual Studio and click “Stop” or close your application. After collection, the gathered information is analyzed and a detailed report is generated. The report shows you the same CPU utilization graph as before, but with a detailed breakdown of the functions that were using the CPU.
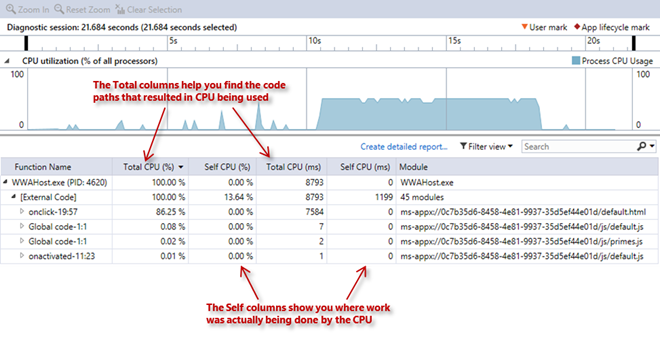
The CPU Usage tool measures the CPU’s resources in terms of how much time each core in the CPU spends executing your code, commonly known as CPU time. We measure CPU time by taking a low-overhead statistical sample of the functions being executed on each core over time. Samples are taken once a millisecond and the measured CPU time t is generally accurate to +/- sqrt(t) ms.
The call tree at the bottom shows a breakdown of the CPU activity in the selected time range by both the relative percentage of CPU utilization and absolute amount of CPU time attributed to each function. You can select regions of elapsed time on the above graph to see what functions were using the CPU during that time, which is useful for isolating specific performance issues.
The CPU usage for each function in the call tree is displayed in four columns:
- **Total CPU (%). **The percentage of the CPU activity in the function and functions it called, out of the app’s CPU usage during the selected time range.****
- Self CPU (%). The percentage of CPU activity in the function but not in functions it called, out of the app’s CPU usage during the selected time range.
- Total CPU (ms). The amount of time in milliseconds a CPU core spent in the function and functions it called.
- **Self CPU (ms). **The amount of time in milliseconds a CPU core spent in the function, but not in functions it called.
Using these columns you can find the code paths with the highest usage of the CPU, and estimate how much your app’s CPU usage can be reduced by optimizing or eliminating those code paths.
It is worth noting that the CPU Usage tool replaces the CPU Sampling tool for Windows Store apps, and we will be adding new features to the CPU Usage tool in future releases. If there is a feature you found useful and it is not available in the new tool, for now you can still use the previous CPU Sampling tool to view the data by clicking on the *Create detailed report… *link. If you do that, please let us know what feature you missed the most so we can prioritize adding to the new tool.
Let’s see it in action!
Let’s take a look at how to use the key features of the tool to solve a performance problem in a simple app. You can follow along with the steps in this section by downloading the sample app code.
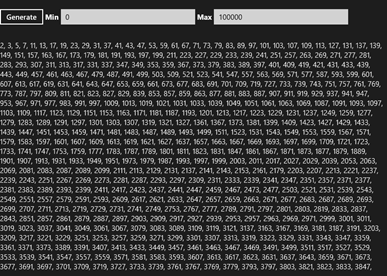
Here we have a JavaScript application that uses a C# library to calculate prime numbers. When we click Generate it calculates prime numbers for the specified range and then shows the list of primes on the screen.
The sample application we are using displays prime numbers using a mix of C# and JavaScript code
When we put in large numbers (in this case a max of 100,000) and click “Generate”, the app becomes unresponsive for around 8 seconds before the primes are displayed and the app can be interacted with again. Instead of looking through code and guessing at performance issues, let’s run the tools and find out exactly where the performance issue is.
First, we run the CPU Usage tool by going to Debug -> Performance and Diagnostics, selecting CPU Usage, and clicking Start. We then reproduce the issue by clicking the Generate button with Max set to 100,000. Now that the tool has collected data for our performance issue, and we can go back to Visual Studio and click Stop to see a report of the CPU Usage by function.
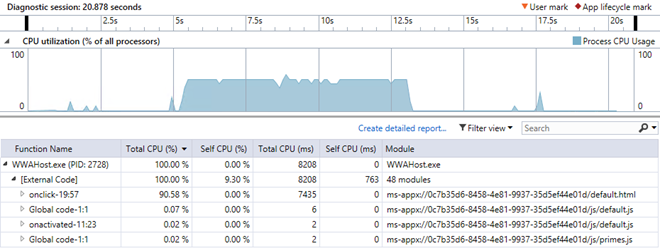
The high CPU area corresponding to when we clicked the Generate button is clearly visible in the report
From the generated report we can clearly see the area of heavy CPU corresponding to when we clicked the Generate button. We can focus our investigation on the high-CPU area by selecting it (with the mouse).
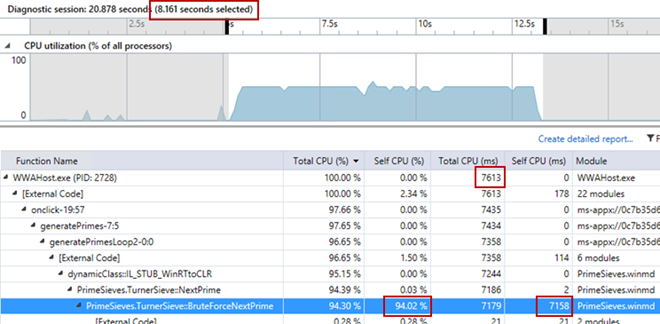
7613 ms of CPU time was used during the selected 8.2 seconds of elapsed time,
94.02 % (7158 ms) of which was in the BruteForceNextPrime function
We can see that out of the 8.161 seconds of selected time, there was 7613 ms of CPU time used by our app. Since the CPU time is close to the elapsed time, it is likely that this operation is CPU-bound and we can reduce the overall time it takes to generate the list of prime numbers by reducing our usage of the CPU. Expanding the nodes with the highest total values in the call tree, we can follow the CPU-intensive code path from our JavaScript UI code into the C# library code. The [External Code] entries indicate time spent in the platform and runtime on behalf of our code doing work such as rendering the UI, initializing the app, and garbage collection.
After following the highest total costs, the data shows us that 94.30% (7.2 seconds) of CPU time was spent inside of the aptly named BruteForceNextPrime function. We can locate this function in our project by right-clicking on the line in the call tree and clicking “View Source” or by selecting the line and pressing Ctrl+G. Without having to look at any other code in the app, we can look for opportunities to reduce the amount of work being done in the BruteForceNextPrime function.
private int BruteForceNextPrime()
{
    // Compute prime by dividing each prime candidate by numbers down to 2
    int primeCandidate = _knownPrimes.Last();
    bool divisorFound = true;
    while (divisorFound)
    {
        // search for divisors for the next prime candidate
        primeCandidate++;
        divisorFound = false;
        for (int divisor = 2; divisor < primeCandidate; divisor++)
        {
            if (primeCandidate % divisor == 0)
            {
                divisorFound = true;
                break;
            }
        }
    }
    return primeCandidate;
}
Looking at this function we see that we are computing primes by attempting to divide each candidate prime by numbers down to 2. Instead, we can attempt to divide only by prime numbers that we have already found, since any non-prime number can be broken down into a factor of primes. We re-write the code to use the list of known primes when searching for future primes.
private int SavedListNextPrime()
{
    // Compute prime by dividing each prime candidate by only previously found primes
    int primeCandidate = _knownPrimes.Last();
    bool divisorFound = true;
    while (divisorFound)
    {
        // search for divisors for the next prime candidate
        primeCandidate++;
        divisorFound = false;
        foreach (int divisor in _knownPrimes)
        {
            if (primeCandidate % divisor == 0)
            {
                divisorFound = true;
                break;
            }
        }
    }
    // no divisors were found for the last prime candidate
    return primeCandidate;
}
This algorithm does fewer divisions, but it also has to iterate over the list. It is most likely faster but to be sure we can run the CPU Usage tool again with this new function to see how it performs.
We have reduced the elapsed time to 2.329 seconds by reducing the CPU time to 2.11 seconds
This time it took only around 2.33 seconds of time, of which 2111 ms of CPU was used. Much better! Another approach we can try is to use more CPU cores for a shorter period of time. In the graph above, we are only using around 50% of the CPU resources on the system (one of the two processors). In theory, we could make prime generation faster by using closer to 100% of the CPU for half the time. To accomplish this, we make our prime generator search for primes in parallel by using a Parallel.ForEach loop.
private int ParallelNextPrime()
{
    // Similar to saved list algorithm, but parallelizes the division by previously found primes
    int primeCandidate = _knownPrimes.Last() + 1;
    ParallelLoopResult loopResult;
    do
    {
        loopResult = Parallel.ForEach(_knownPrimes, (p, loopState) =>
        {
            if (primeCandidate % p == 0)
            {
                loopState.Break();
            }
        });
        if (!loopResult.IsCompleted)
        {
            // divisor was found, try another candidate
            primeCandidate++;
        }
    } while (!loopResult.IsCompleted);
    return primeCandidate;
}
In this case, we are able to search for divisors in parallel. Parallelizing code does not always improve performance because of the added synchronization cost, and some problems are hard to break down in to parallel units of work. Let’s take a look at how well the above code performed:
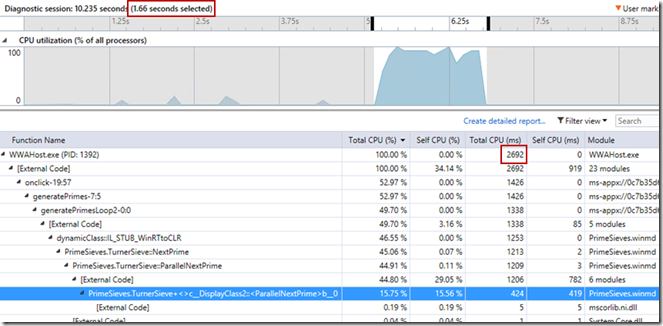
By parallelizing the code we have reduced the elapsed time to 1.66 seconds, but increased the CPU time to 2.70 seconds
The time went from 2.33 seconds down to 1.66 seconds, approximately a 29% improvement! However the total CPU time went up from 2111ms to 2692ms, a 28% increase in CPU usage. At this point it’s important to decide whether you care more about improving user-facing performance or conserving CPU resources in order to, for example, maximize the scalability of the code. In this case, using the ParallelNextPrime method results in the best user experience but using the SavedListNextPrime method results in the lowest amount of CPU time spent executing code.
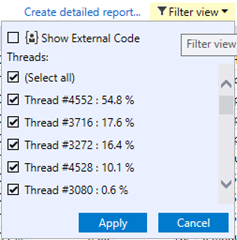
If you want to see how your code is being parallelized, you can use the filter view control to see how much CPU time was spent on each thread and filter the CPU activity to specific threads.
The Filter view control allows you to view CPU usage by thread and show external code
Here we can see that one thread used 54.8% of the CPU time, while the rest of the CPU time was mainly split between three other threads. By filtering to specific threads you would see that thread #4552 was the main thread and threads #3716, #3272 and #4528 were the worker threads that Parallel.ForEach used to look for divisors.
By checking “Show External Code” in the dropdown, we can find out exactly what the extra overhead in the system is. In our case we see that the overhead in the system is work being done by the task library to create and dispatch units of work to run in parallel. The task library work is spread across many different functions, and some of the larger portions of work are highlighted in the screenshot below:
When we turn on Show External Code we can see that the added CPU usage was in the task library
By default, when you show external code, function names will not be shown for much of the library and system code. This is because Visual Studio needs symbol files in order to decode CPU activity into function names. If you want to see function names for library or platform code, you can enable Microsoft Symbol Servers under symbol file locations in Tools -> Options -> Debugging -> Symbols. Once enabled, Visual Studio will automatically download and cache the symbol files when a profiling report is opened.
Try it out and send us feedback!
If you have Visual Studio 2013 you can try out the new CPU Usage tool today by downloading and installing Visual Studio 2013 Update 2. The algorithms used in this blog post for calculating prime numbers are by no means the most efficient and were kept intentionally simple to demonstrate how to use the tools. We also encourage you to download the sample code, try out your own algorithms and use the CPU Usage tool to see which ones are fastest and/or use the least amount of CPU time.
We are excited to make the CPU Usage available to you and would love to hear your feedback! If there’s something that would help you to better optimize CPU usage in your app, send us feedback on our MSDN Forum, or using Send-a-Smile from within Visual Studio.



0 comments