
One of the top questions we get from developers building extensions for Visual Studio Team Services is “Are people using my extension“? The Visual Studio Marketplace (launched in November and currently in preview) shows the number of Team Services accounts an extension is installed to, but not the number of people actually using it or how these people are using it. Enter Visual Studio Application Insights.
Get an overview of extensions for Team Services. Extensions are also available on-premises with Team Foundation Server 2015 Update 2 RC1 (see the release notes).
Application Insights, or AI, is a Microsoft Azure-hosted service that provides real-time monitoring of Java, .NET, JavaScript (and more) applications. Application Insights can alert you to problems in your extension, and almost as importantly, it can help you understand usage of your extension, and help answer questions like:
- How many people are using my extension?
- Which features of my extension are most/least used?
- What geography are users accessing my extensions from?
- Did I just break all of my users with my update at 3 AM today?
The answers AI provides are not just fun facts. AI can help guide your decision-making process (should you stop investing in a particular feature or should you double down?). AI can alert you to problems in your extension (before there is a mass exodus by your users). AI can also help you optimize your extension based on where users are accessing it from and what browsers they are using.
This post will guide you through the simple steps of adding tracking to a web-based Team Services extension.
See real code in action: check out the Branch Delete extension code on GitHub.
Create an Application Insights resource
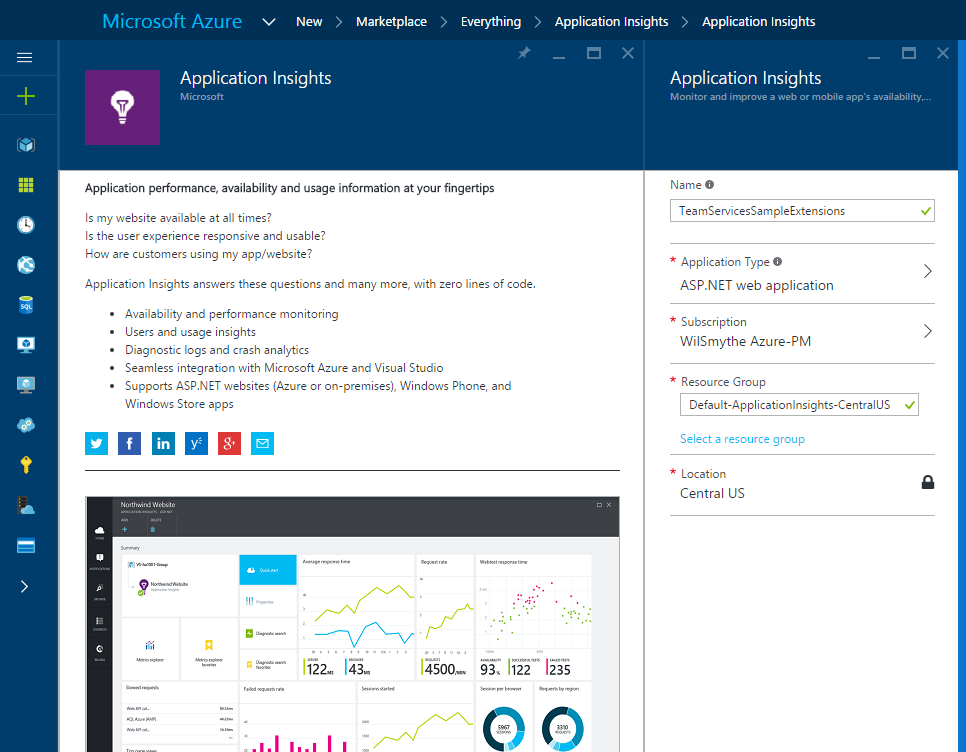
First step, is to sign-up for an Azure subscription. To get started, visit the Application Insights overview page.
- In the Azure Portal, click the New button, and search for Application Insights.
- Click Create, enter a name for your AI resource, pick an application type, and click Create.
For the name, I chose a name that equates to my Team Services publisher name so that I can monitor usage for multiple extensions in one AI instance. You might just chose to create one AI instance per extension. I chose ASP.NET as the application type even though my extension is fully-hosted by Team Services.
Tracking activity in your extension
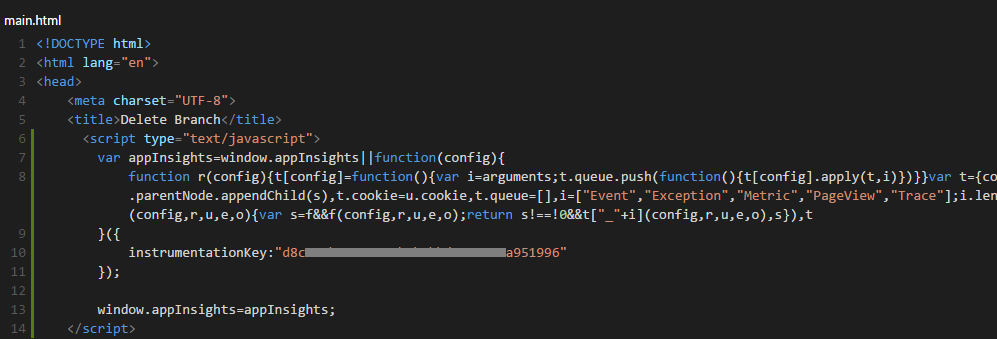
Now the fun part. Start by grabbing the provided bootstrapping snippet. You will embed this code in your web extension’s main HTML page.
Add the AI JavaScript SDK
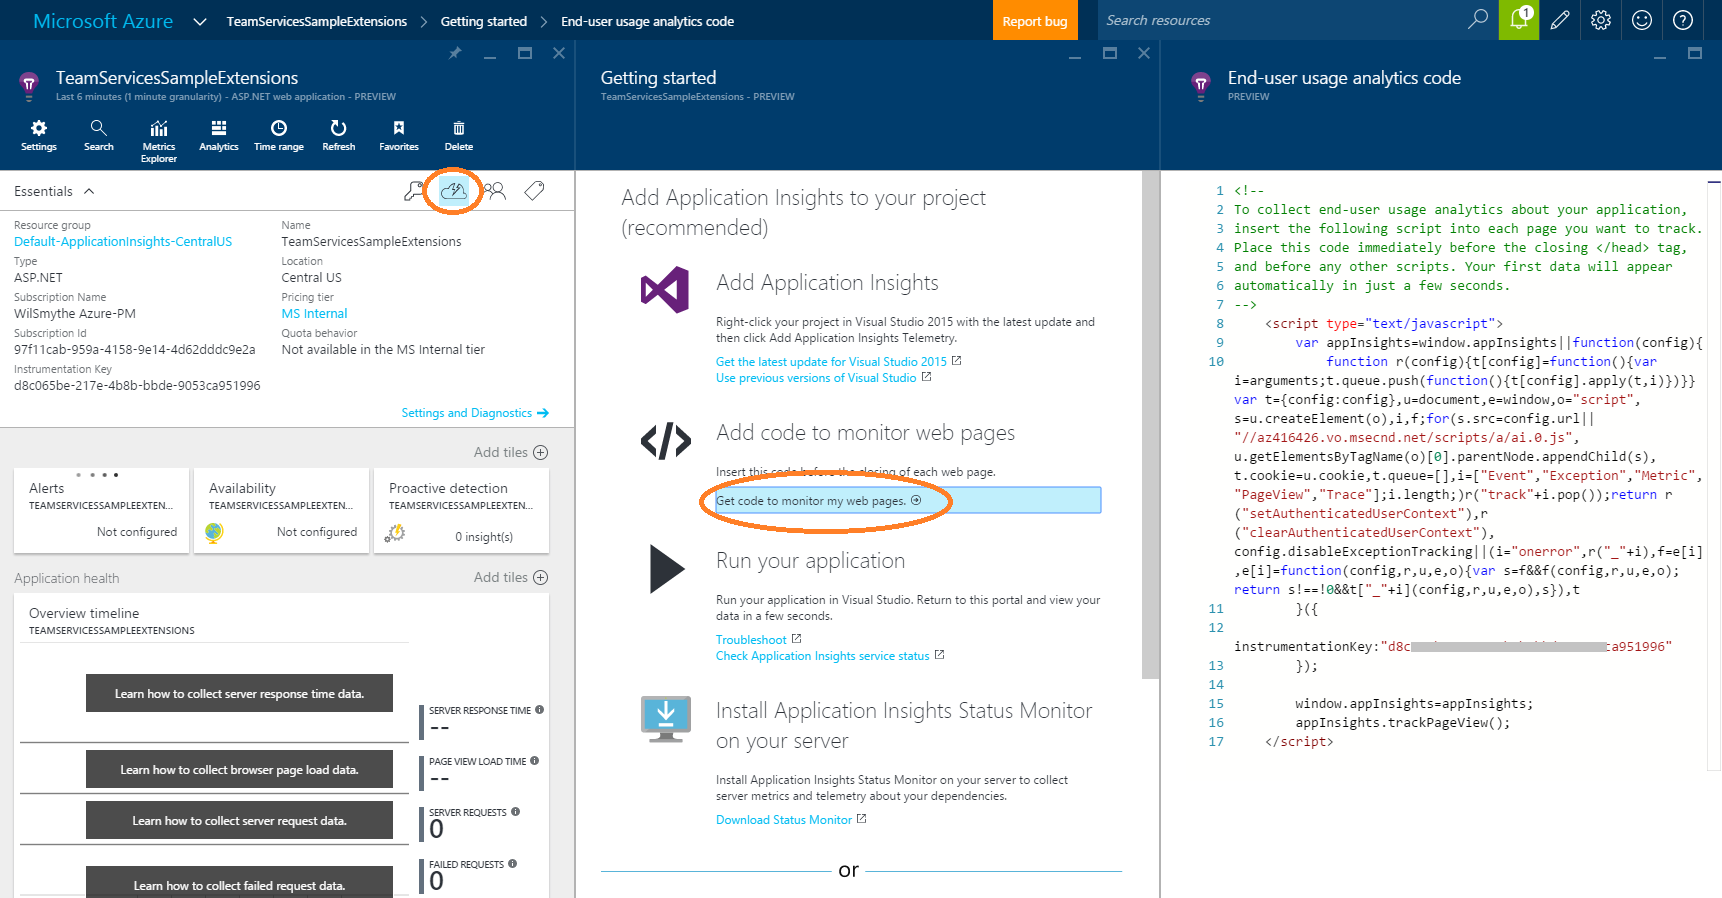
AI provides you a customized JavaScript snippet that you can embed in your extension’s main page.
- Click the get started icon in the main blade and then click the Get code to monitor my web pages link:

- Copy the JavaScript code snippet.
- The snippet is customized. It includes an instrumentation key that connects the telemetry data coming from your extension to this AI instance.
- In your extension’s HTML page, paste the snippet just before the ending </head> tag.
Read an in-depth explanation of how this script works.
Track page views
Let’s track when our extension is loaded into the browser. This may be when a page is shown to the user in for example, a hub or work item form extension. This may also be when Team Services loads a page that is supporting a menu or toolbar contribution.
Every extension is accessed by an authenticated Team Services user under the context of a Team Services account. We want to include this data with the telemetry data that is sent to AI from our extension. Note: you should never send personally identifiable information, or PII. Send only the data you need to understand usage patterns, not data (name, email address, etc) that can identify a person.
- From the code you pasted into the <head> section, remove the line that calls the trackPageView (we will call this later in our page).
- Define an anonymous function that will be called when the VSS (Visual Studio Services) web extension SDK is ready. This will ensure your extension page has been loaded and has access to context information.
- Add a call to the setAuthenticatedUserContext function on the window.appInsights object, passing the current user’s ID as well as the team project collection ID.
- Add a call to the trackPageView function, passing a name for your page. This is optional, but will make it easier to search later.
For convenience, here is the code:
<script>
 VSS.init({ usePlatformScripts: true });

 VSS.ready(function() {
    window.appInsights.setAuthenticatedUserContext(
        VSS.getWebContext().user.id,
        VSS.getWebContext().collection.id);
    window.appInsights.trackPageView("BranchDelete");
 });
</script>
You can also call trackPageView in your extension as users navigate within it. For example, if you have a hub with multiple pivots, you can call this function when a user transitions from one pivot to another.
Track custom events
Let’s now add tracking for a custom event. This will allow us to know how (and if) a particular feature of our extension is being used.
- In your JavaScript code where an action is being performed by a user (or whenever you want to track something), add a call to the trackEvent function on the appInsights object.
- The first parameter is the name of the event. Give it a descriptive name so you can find it later.
- The second parameter is an optional object that can contain one or more additional properties that you might want to search/query on later.
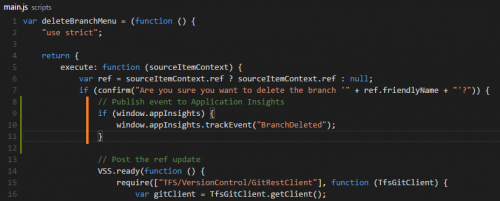
   // Publish event to Application Insights
   if (window.appInsights) {
      window.appInsights.trackEvent("BranchDeleted", { "customProperty": "xyz" } );
   }
Package and publish your updated extension via the Visual Studio Marketplace.
View and search the data
Now give your extension a try, making sure to hit all the places where you added page or event tracking code.
- Open the Azure Portal and navigate to your Application Insights resource
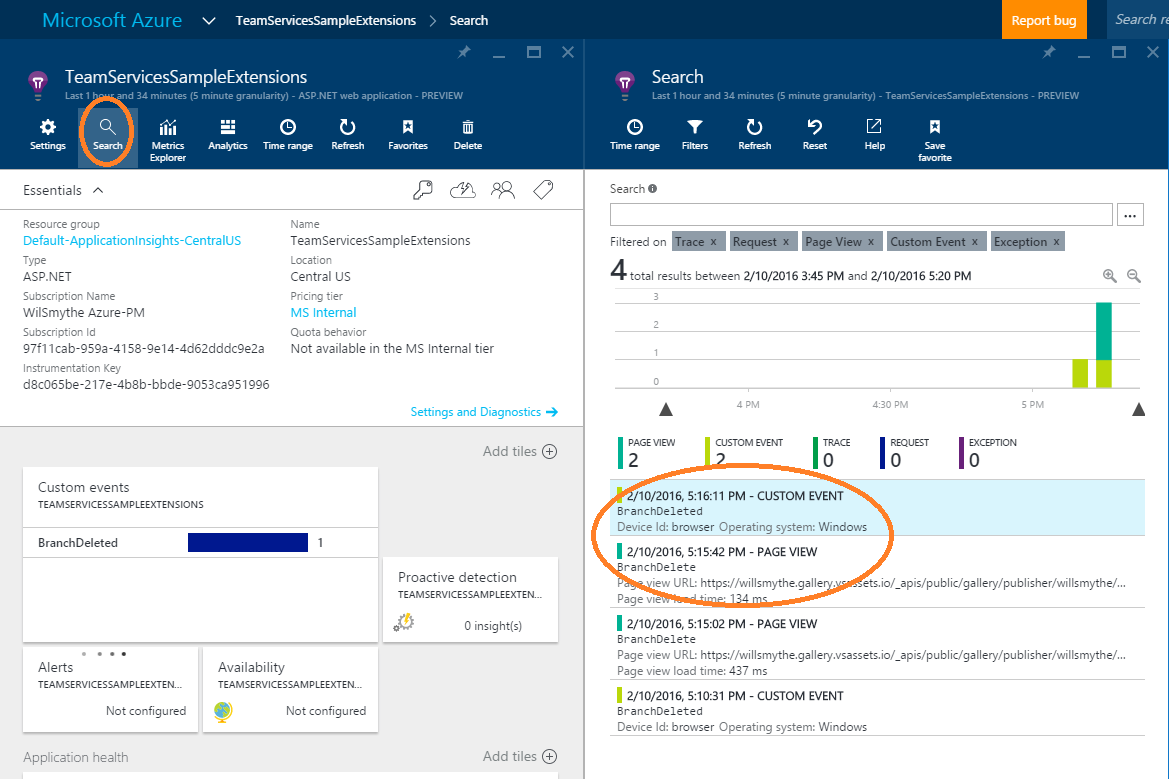
- Click Search at the top of the main blade.
- You should also see data appearing. For example, our sample extension is showing data about when it was opened and events that have already been triggered

Other useful features
Application Insights has many other features that Team Services extension developers will find useful, including:
- Usage: users, sessions, and page views
- Alerts: get notified about potential back-end service problems
- Problem diagnostics and metrics: Understand where problems are happening
Start exploring all of the features today: Get started with Application Insights
Will Smythe, Program Manager on Visual Studio Team Services
0 comments