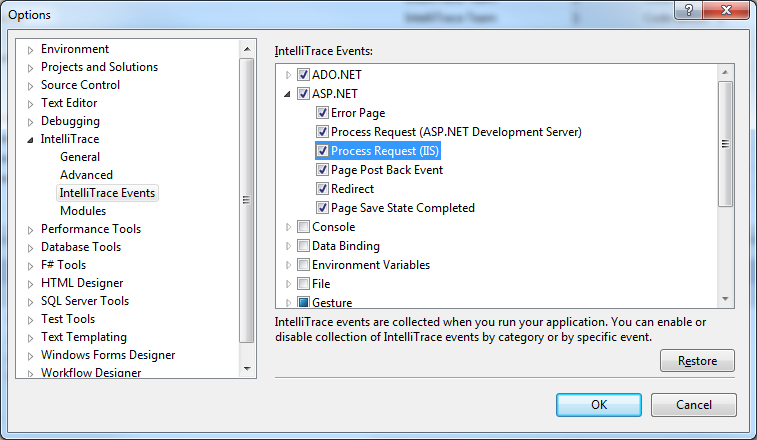
With the release of the CTP of Visual Studio vNext we are including the ability to collect IntelliTrace logs from web applications running in IIS 7.0 and 7.5 without requiring Visual Studio installed on the web server.
Several demos exist of the stand-alone Intellitrace data collector including one by Cameron Skinner and Brian Keller at TechEd earlier this year and another by Tracey Trewin and Mark Groves at the //BUILD/ conference. Recordings of these sessions are available.
What you get out of the box
The stand-alone Intellitrace data collector .cab install file is available with the CTP release of Visual Studio. With a default installation the file is located at c:Program Files(x86)Microsoft Visual Studio 11.0Team ToolsTraceDebugger ToolsIntelliTraceCollection.cab
Included with the cab are two collection plans, collection_plan.ASP.NET.trace.xml and collection_plan.ASP.NET.default.xml. The collection_plan.ASP.NET.default.xml collection plan equates to the default IntelliTrace setting in Visual Studio, including which events are enabled and which are not. The collection_plan.ASP.NET.trace.xml collection plan is the same as selecting “IntelliTrace events and call information” from the General tab of the IntelliTrace options in Visual Studio.
The details of these settings are available on MSDN. For more information, see Collecting IntelliTrace Data By Using the Stand-Alone Collector.
Modifying the Collection Plan
Just as you are likely to make modifications to the IntelliTrace settings in Visual Studio you may want to modify the collection settings when using the files from the cab. The easiest way to think of this is by looking at the options in Visual Studio and then making the equivalent change in the collection plan xml file that you wish to use with your application.
Log file size is controlled by the MaximumLogFileSize as measured in 64kb blocks. The default is 4000 which equates to a 256MB log file.
Each of the events listed in the Visual Studio options matches to a DiagnosticEventSpecification in the xml. For example the event “Process Request (IIS)”

matches the DiagnosticEventSpecification as shown.
<SettingsName _locID=”settingsName.HttpApplication.AssignContext”>Process Request (IIS)
<SettingsDescription _locID=”settingsDescription.HttpApplication.AssignContext”>Asynchronous call to an HTTP handler initialized.
<ShortDescription _locID=”shortDescription.HttpApplication.AssignContext”>{0} “{1}”
<LongDescription _locID=”longDescription.HttpApplication.AssignContext“>Asynchronous call to an HTTP handler initialized.
<DataQuery index=”1″ maxSize=”256″ type=”String” name=”Request HTTP Method” _locID=”dataquery.HttpApplication.AssignContext.RequestHTTPMethod” _locAttrData=”name” query=”_request._httpMethod”>
<DataQuery index=”1″ maxSize=”256″ type=”String” name=”Request file path” _locID=”dataquery.HttpApplication.AssignContext.Requestfilepath” _locAttrData=”name” query=”_request._clientFilePath._virtualPath”>
Ok, so that’s a lot of XML behind a simple setting in Visual Studio. However if all you want to do is either turn it on or off (just like checking the checkbox in Visual Studio) all you need to do is work with a single xml attribute. For each DiagnosticEventSpecification there is a single attribute controling whether the event is collected. It is the “enabled” attribute on the DiagnosticEventSpecification element. But wait, you say, there is no such attribute on the DiagnosticEventSpecification element in the sample! True enough, if the attribute is omitted the default behavior is to collect that event. In the example above the following two DiagnosticEventSpecification elements would be considered equal.
If you do not want to collect a specific event you can disable it by setting the enabled attribute to false like this:
Note: To collect any events at all you must also ensure that the DiagnosticEventInstrumentation element has the attribute “enabled” set to true. You can think of this element is the master control for all of the events and determines whether they are collected or not regardless of the enabled setting on any individual DiagnosticEventSpecification.
If you compare the two collection plans that are provided with the cab file you will see that the only difference between the two of them is element that controls the difference between Events Only collection and Events and Call Information. The element is
Setting the enabled attribute to true on the TraceInstumentation element enables the collection of call information.
As you can see the enabled attribute is used to control much of the collection capabilities of IntelliTrace.
The next section to look at is the ModuleList found nested within the TraceInstrumentation element.
This section maps to the Modules section of the options in Visual Studio. The isExclusionList attribute maps to the selection between “Collect data from all modules except for the following” option and the “Collect data from only the following modules” option. It is important to note that this only applies to the collection of call data and does not apply to the IntelliTrace events.
The default behavior is to use a “black list” approach in which the listed modules are excluded from call data instrumentation. The public key that are listed represent Microsoft keys. Therefore the list will generally not instrument any of the Microsoft modules that may contribute to your application.
Often it may be advantageous to only instrument specific modules by using a “white list” approach in which the specific modules are listed explicitly. This will keep call information collection more focused on just the modules of interest. This is also an easier way to eliminate third party modules that may be consumed by your application. To target only the modules that represent the Fabrikam code for an application the module list might look like the following:
Using this configuration will eliminate any module that does not have the string “Fabrikam.” in the module file name. This will keep collection of call information tightly scoped to only the modules of interest which will improve collection performance when including call data.

0 comments