We’re excited to introduce our new usage analysis experience for both your web applications and device apps (Windows Phone and Windows Store applications).
Using Application Insights, it’s now easy to answer common questions about your app adoption, your users’ profile, the way your users experience the app, your top used features, and much more.
Knowing better the users who experience your application, as well as understanding the users’ behavior and needs, lets you improve your app, focus your development work on the most significant user scenarios and meet your business goals.
**Learn about adoption of your app******
After you release your app, there are typical questions you’d like to answer. Using Application Insights, you can easily and quickly analyze the following:
- Have people already started using my app? If so, how many?
- What is the adoption trend over time? For example, was my campaign effective? Was there a rise in adoption after my last blog post?
- How many sessions did my users initiate?
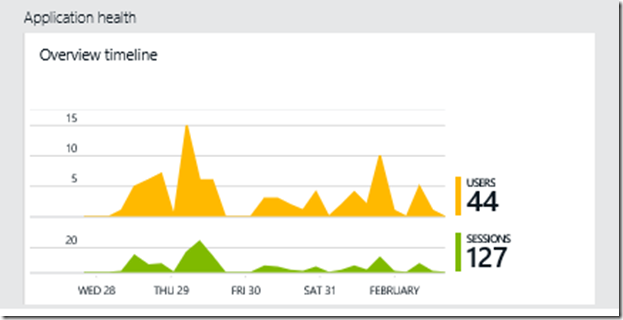
A quick look at the overview blade answers these questions:

Looking briefly at these charts, we can see that within the period selected for the chart, the app has had 44 distinct users, who have used it in 127 sessions. That is, at least some of the users came back for more than one session, and therefore may be related as returning users.
The blade above relates to a device app. However, the offering presented in this blog works similarly for web apps as it does for device apps.
Note that the user and session counts, particularly for web apps, may include synthetic traffic, derived for example from Application Insights web tests, Keynote, Gomez or search engines’ bots.
Further the above, one may be interested in tracking the exposure of an app to new users. Click on the users chart for more details on your app users, and you get this:

Using this chart, you can easily learn the number of new users, compared to total, and their trend over the chart period. The new users chart can be a measure in this example of the effectiveness of marketing events:
- New users mainly appeared at two points in time: The first (Jan 29th) was after an email that announced the app release, and the second (Feb 1st) after announcing a new version.
- At other times, most of the users who experienced the app were returning users.
**Learn about your users’ profile******
You are pleased to know that people are using your app. But now there are deeper questions to ask, which can help you tailor your app to your users’ devices and locations.
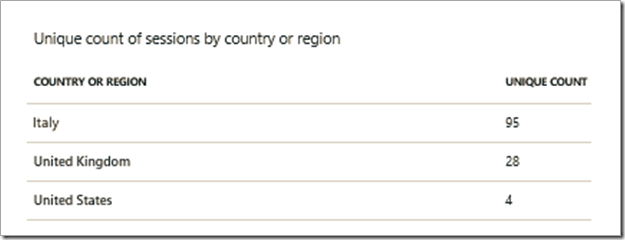
To find out where your users’ sessions are coming from, click ‘Top sessions by country or region’ (the ‘Top sessions by country or region’ part is presented on the overview blade):

If you’d like to see trends in these figure, you can ask to segment sessions metric by location:

Knowing the above helps you to locate datacenters, prioritize language support or other localization investments, or assess campaign effectiveness in specific geo-regions.
On the overview blade click ‘Top devices’, to find out about platforms and devices:

Currently, the presented device model relates to device manufacturer name. The first model suggests for example a Europe variant of the Lumia 920, whereas the last suggests a Philippines variant of the Lumia 925, both manufactured by Nokia.
Knowing the platforms used and the sessions per each helps you assure your app works well on the most common configurations. Similarly, knowing the devices and their screen resolution helps you adjust your app content and images so that it fits in a screen without scrolling.
Again, you can show these figures as segmented charts of standard or custom dimensions, and there is a variety of other standard usage metrics you can display (for more details see Application Insights – Metric Explorer blog posts, Part 1, Part 2, [Part 3][12]).
**Learn what users are doing with your app******
Now let’s consider the usage of a specific app page or feature. Such data is important for planning development work: prioritizing bug resolution, or determining future investments.
Typical questions which may affect your app development are:
- What pages are most visited by my users?
- What are the most used features? And the least used?
- How successful is a feature release over time?
- How many users had difficulties with my app? What are the common error pages?
Start from the page views chart at the overview:

Click through for more details:

You can instantly see the following insights for the example, which is a weather application:
- The most popular pages are the main page, the weather forecast page and the search page (in which users search for a city by using a free text search option).
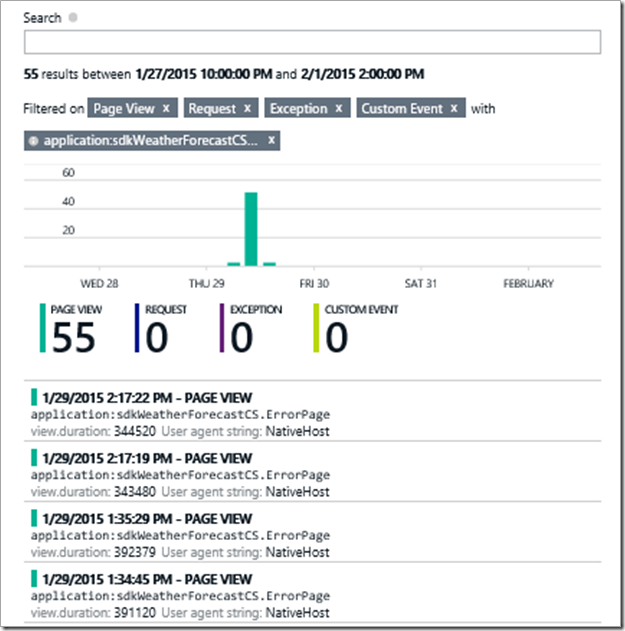
- Surprisingly, in ~16% of the sessions an error page was presented (20 sessions in which an error page was presented out of 127 sessions), reporting no support for a selected city (~11% of the users encounter the error page).
- Over time, the session page count (that is, the number of pages per session) decreased. Following a new release, users try lots of pages per session while they get familiar with the app’s capabilities, but over time they check the weather for their relevant cities only.
Why do so many users see the error page? A deeper understanding of the error cause and context may help in prioritizing further development work.
Click the ErrorPage row to see a list of events in which the error page was shown. You can see below a Diagnostic Search blade, with the relevant filters already populated:

Select the first page view, and under the related items section ask to view ‘All telemetry for this user session’:

Now you can track the session flow and just the other events in this session:

In this search screen, we can see that the error page followed a custom event which logs a user request to search for a city. From the custom event details, you can see that the user asked to view the weather in Milan, which is not supported in the current version of the app.
In this example app, we inserted into the code a number of calls to TrackEvent(). You can create these custom events to log when users use selected features – which don’t always correspond to page views.
Custom events enable you to track users’ actions and to measure the popularity of a specific feature. To each event you can add custom properties (such as searched city in the example) as a basis for further analysis.
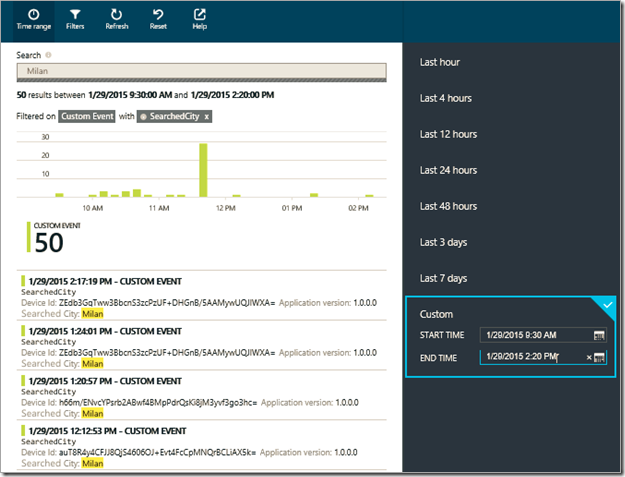
Recalling that a high percentage of the sessions originated in Italy, and in order to find the popularity of a scenario in which a user asks to view the weather in Milan, narrow your filter in Search Explorer to the period in which error pages occurred, and search for custom events which indicate a user ask to view the weather in Milan:

You can see that 50 custom events (out of 55 unsupported requests) indicate a user search asking for the weather in Milan.
Understanding the users’ need, the app developer decided to release a new app version with extended support for Milan weather.
A few days later, the app developer is happy to see a significant decrease in error page occurrences. Furthermore, by segmenting the custom events by searched city, the developer identifies a high volume of sessions in which a user views Milan weather:

Hooray! The development work was worthwhile.
**Know your users to delight them better******
To understand where your app should go next, it’s important to know what your users are doing with your app. It may not be what you expected!
Application Insights gives you the power to find out easily which are the most useful features, which are the most common issues, and to work out why a feature does or doesn’t work.
More than that, it gives you the ability to systematically assess each feature of your app, incorporating analytics into your development cycle.
Having a complete 360° views of your applications’ availability, performance and usage, which can enable fast & powerful insights, helps you plan new improvements, prioritize your backlog, and delight your users.
Learn more about Application Insights, usage monitoring and tracking custom events
[12]: http://blogs.msdn.com/controlpanel/blogs/posteditor.aspx/Part 3http:/blogs.msdn.com/b/visualstudioalm/archive/2015/02/07/metrics-explorer-custom-metrics-and-events.aspx

0 comments