Updated 2015-07-23: Updated for Visual Studio 2015 RTM
Updated 2015-06-01: Added symptom for ASP.NET MVC apps
PLEASE NOTE: These issues have been resolved with Visual Studio 2015 RTM. These workarounds should no longer be necessary, and implementing them will not resolve other issues. If you are using the RTM version of Visual Studio 2015, and are running into errors with similar symptoms, please report them via the Feedback tool inside Visual Studio.
The Diagnostic tools window is the home of IntelliTrace, debugger events and the Memory Usage tool. If you’ve run into an error when trying out the Diagnostic Tools window, first make sure you’re debugging a supported project. Also note that many errors can also be cleared up by restarting Visual Studio.
Beyond that generic advice, thanks to the efforts of several users who filed bug reports through the Send-a-Smile tool, we became aware of a specific issue with the Diagnostics Tool window, related to the Windows display language and VS language packs. This issue will be fixed in the next public release of Visual Studio 2015. Please read on for the Symptom, Cause, and Workarounds.
Symptom
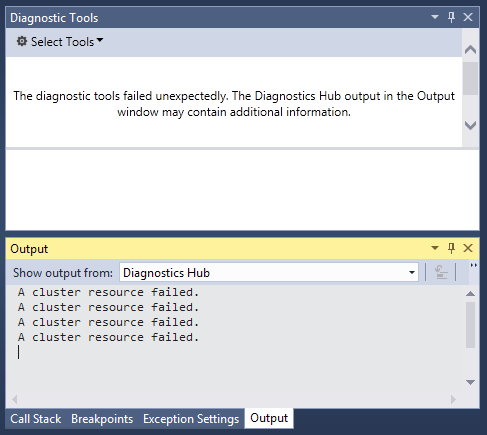
When you start debugging, the Diagnostic Tools window [Debug -> Show Diagnostic Tools] shows the following error message instead of displaying the diagnostic tools:
“The diagnostic tools failed unexpectedly. The Diagnostic Hub output in the Output window may contain additional information.”
If you then examine the Diagnostic Hub output from the Output window [Debug -> Windows -> Output] you will see the following entry:
“A cluster resource failed.”
If you restart debugging, VS, or your dev machine, the error recurs.

For ASP.NET MVC apps: The Diagnostic Tools window may display this error instead, “The diagnostic tools window does nor support debugging using the ‘Script’ debug engine.” The cause and workarounds are the same.
Cause
This issue surfaces when the locale of the OS does not match any of the installed language packs for VS. For example: the OS is set to es-MX (Spanish-Mexico) and VS only has the en-US (English-United States) language pack installed. This issue will occur even if the language matches, but the region is different, e.g. en-US and en-GB.
Workarounds
There are three known workarounds. Some users have reported that not all workarounds work for them. Choose the one that suits you best:
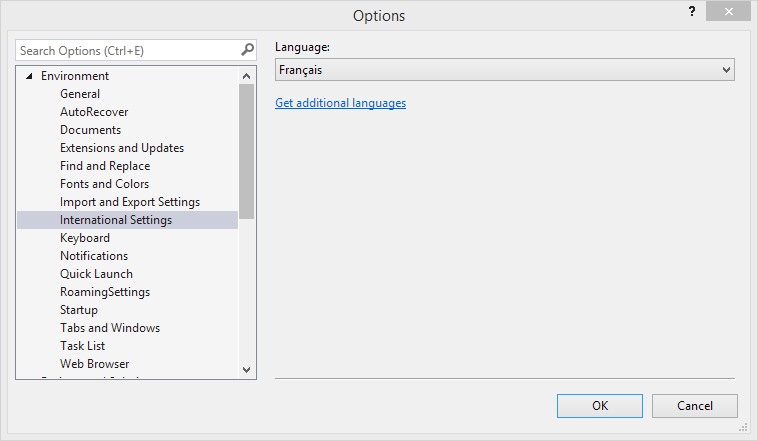
1. Change the VS Language to match the OS display language [Tools -> Options -> Environment -> International Settings]. Add new languages by installing the appropriate language pack.

2. Change the OS display language to be the same as the VS language. In Windows 8.1 this can be changed in the Region and Language page in the PC Settings app.
3. Copy DiagnosticsHubMsg.dll from
*
Note: Copying DiagnosticsHubMsg.dll from one locale to another will retain the strings from the original locale. Copying from 1033 will cause English strings to be displayed instead of the desired locale. For example, you’ll see various English strings in your UI even though the rest of Visual Studio is displaying strings in the display language.
Other Issues?
If none of the workarounds work for you, or if you’re seeing other bugs in Visual Studio 2015 RC, please let us know via the Send-a-Smile tool.

0 comments