Posting this on behalf of Patrick Nelson who is a developer on the Visual Studio Debugger team, and also thanks to Rob Paveza for his help with both of our post regarding JavaScript Just My Code
Do you develop web apps? Do you hate when the debugger keeps stopping in code you don’t care about? Are you tired of accidently stepping into JQuery? In Visual Studio 2013 with Internet Explorer 11, we’ve added Just My Code for JavaScript to help with these very problems.
In our previous blog post we announced Just My Code for JavaScript and discussed it in the context of Windows Store apps. In this complementary blog post I will cover the addition of Just My Code for JavaScript when debugging ASP.NET applications in Visual Studio 2013 using Internet Explorer 11 (*NOTE: * Just My Code requires both Visual Studio 2013 and Internet Explorer 11, the JavaScript Just My Code feature will not work with prior versions of Internet Explorer).
I’m going to run through some examples in this post. If you want to try them yourself, create a new ASP.NET Web Application. I created an MVC app via New Project -> Visual C# -> Web -> ASP.NET Web Application. After hitting “OK”, select MVC and “OK” again.
Create a new script file name Test.js in the “Scripts” folder with this content:
function test1() {
    var result = 1;
    $([5, 10, 20, 40]).each(function (index, item) {
        result *= item;
    });

    alert("Result = " + result);
}

function test2() {
    try
    {
        var a = undefinedFunction();
    }
    catch(e)
    {
        Debug.writeln("Caught exception " + e);
    }
}
In about.cshtml, add the following html code:
<script src="http://blogs.msdn.com/Scripts/Test.js" type="text/javascript"></script>
<li>
      <a onclick="test1()">Run test1</a>
</li>
<li>
      <a onclick="test2()">Run test2</a>
</li>
Stepping into JQuery
Set a breakpoint in Test.js line 3 ($([5, 10, 20, 40]).each(function (index, item) {), start debugging, then go to the “About” page. If you click on Run test1, you’ll hit the breakpoint in Test.js. If you try stepping into this statement with an older version of Visual Studio (or Visual Studio 2013 with Just My Code turned off), you’ll see something like this:
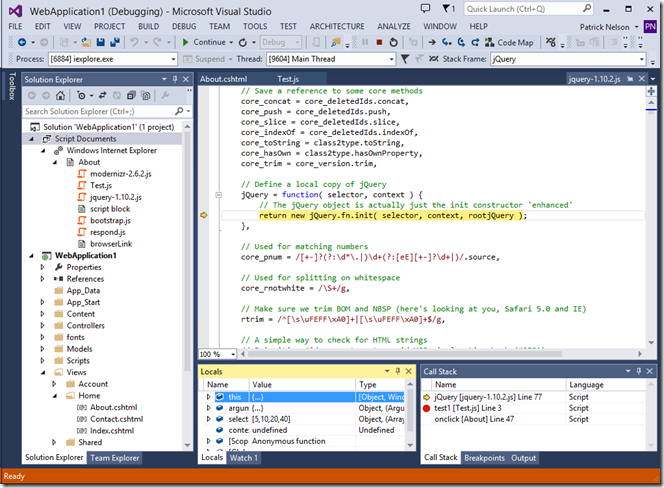
This is definitely not the best debugging experience because most developers don’t care to go stepping through JQuery code. This behavior may also be very confusing to a novice developer. With Visual Studio 2013 and Just My Code, the same step operation will take you directly to the first call to your anonymous function:
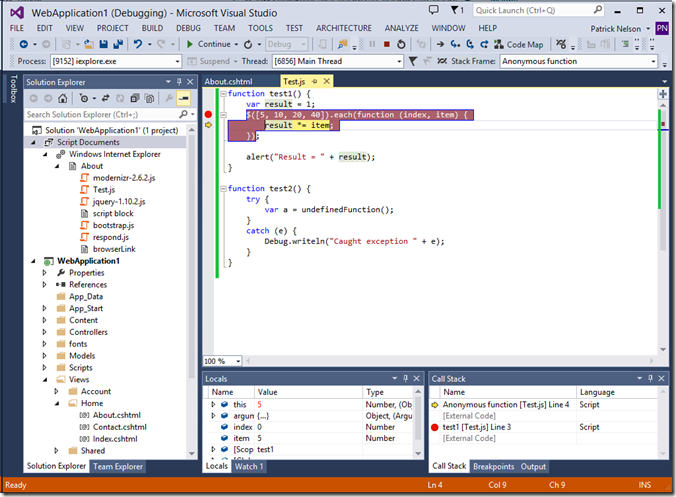
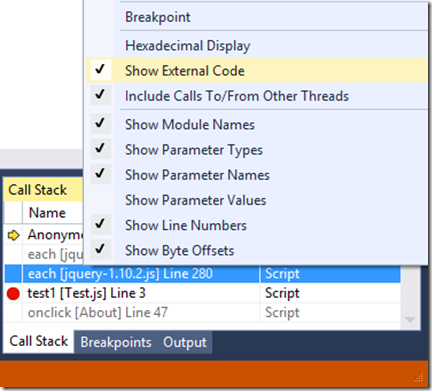
If you look at the Call Stack window, you’ll notice some grayed out frames named “[External Code]”. If you are interested in seeing what the external code is doing, you can take a look at it by right clicking in the Call Stack window, and selecting “Show External Code”:
Exceptions
If you have ever tried to enable stopping on first chance exceptions, you’ve probably seen screens like this many times:
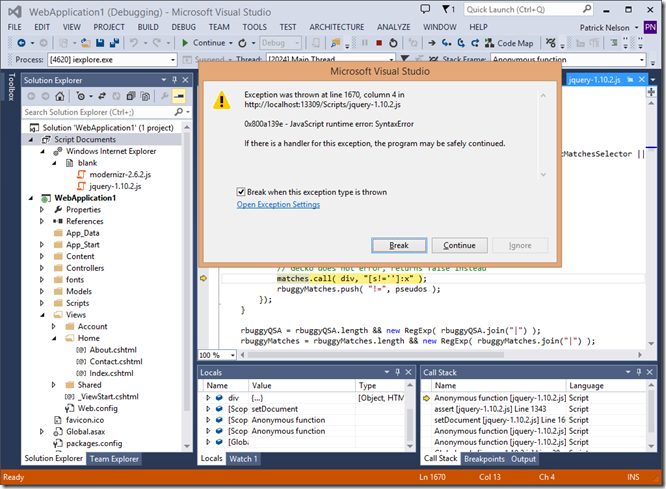
You can try this yourself by going to Debug -> Exceptions, and enabling the debugger to stop when exceptions are thrown (also called first chance exceptions) for all JavaScript exceptions:
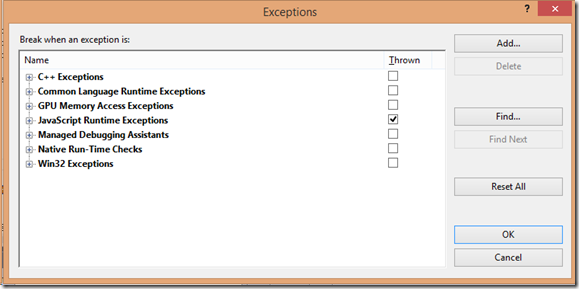
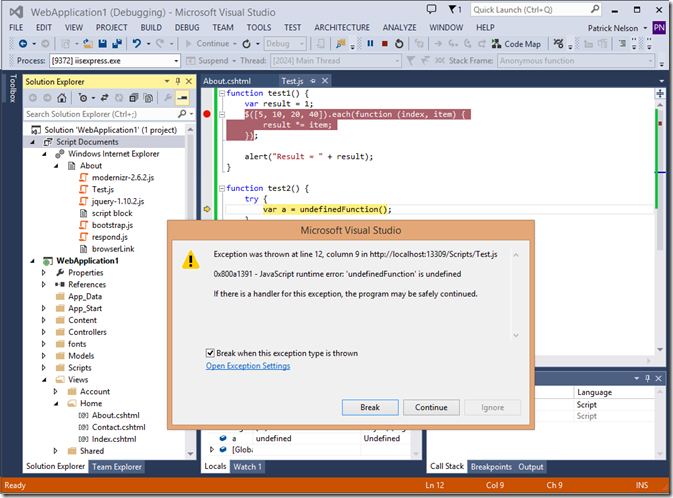
If you turn off Just My Code, enable first chance exceptions, and refresh the About page, you’ll be greeted with the screen above. In fact if you leave this setting on, you’ll be inundated with first chance exceptions in code you aren’t interested in while trying to debug your code. I tried this and had to push “Continue” (F5) 28 times before the About page loaded. Once you turn on Just My Code, all of these exceptions are ignored automatically since they are not in your code. If you want to stop at a first chance exception, click on the “Run test2” link. With stop on first chance exceptions enabled, the debugger will stop on the first chance exception in Test.js:
Summary
In this post I briefly walked you through Just My Code for JavaScript when debugging ASP.NET applications in Visual Studio 2013. We discussed a few of the benefits and showed an overview of the behavior for stepping and exceptions. If you would like a more detailed description of the exact behavior in various situations and how to customize what is considered Just My Code please refer to the aforementioned previous blog post or the MSDN documentation.
If you have any questions or comments please let us know by either commenting below or posting in our MSDN forum.

0 comments