Hello, I am Patrick Nelson, a developer on the Visual Studio Debugger Team.
Authoring apps that are using more than one language is not uncommon these days. For example, some developers prefer one language for the UI layer but use another language (or reuse components in another language) for their business logic. When debugging such apps, most of the time you are either debugging one language or the other (and you select which debugger type you want to use through the project properties), but sometimes you need to have the debugger attached to both. In other words, you want to be using both debugger engines at the same time. It is for this reason that in VS2012 Update 1 we enabled and blogged about interop debugging between Managed and Native code in the same app.
With Visual Studio 2013, we offer the same interop debugging capability for JavaScript and Native code, as I will describe in this blog post.
**Important Notes******
- This feature is only present in Visual Studio 2013 it was removed in Visual Studio 2015
- The feature only works when debugging on Windows 8.1, it does NOT work on Windows 10
Visual Studio 2012 workaround
Before delving into the VS2013 experience, it is worth pointing out that even with Visual Studio 2012, it is possible to debug both code types of the same app simultaneously by starting debugging in one instance of Visual Studio, and then opening another instance of Visual Studio to attach to the same process but with a different debug engine selected (in the project properties)
There are some disadvantages to using this workaround including:
- You need to have two instances of Visual Studio running
- The instance of Visual Studio that is debugging JavaScript code will be unresponsive when the Visual Studio that is debugging native code is in break state.
- Breakpoints have to be set in the correct instance of Visual Studio
- Call stacks are for only one language so it is more difficult to understand the flow between JavaScript and Native code
Visual Studio 2013 experience
In Visual Studio 2013, we are introducing a new debugger type named “Native with Script”. This new debugger type is really what the name implies. It is essentially the Native debugger with some JavaScript support added. This means the “Native with Script” experience will give you the full Native debugging experience, but does not provide the full script debugging experience you will get with “Script Only” debugging. For example, the Watch window and DataTips do not have the same fidelity. Also note the DOM Explorer and JavaScript Console are not available when debugging Native with Script.
To select this new debugger type, go to project properties –> debugging and for “Debugger Type” select “Native with Script”
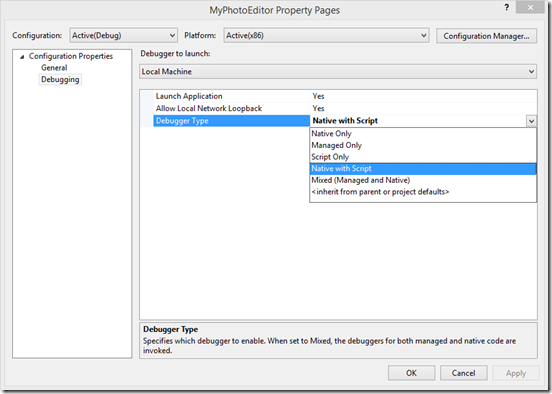
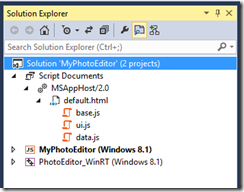
Now when you start debugging, you’ll notice the active script documents load in the solution view as they do when Script debugging:
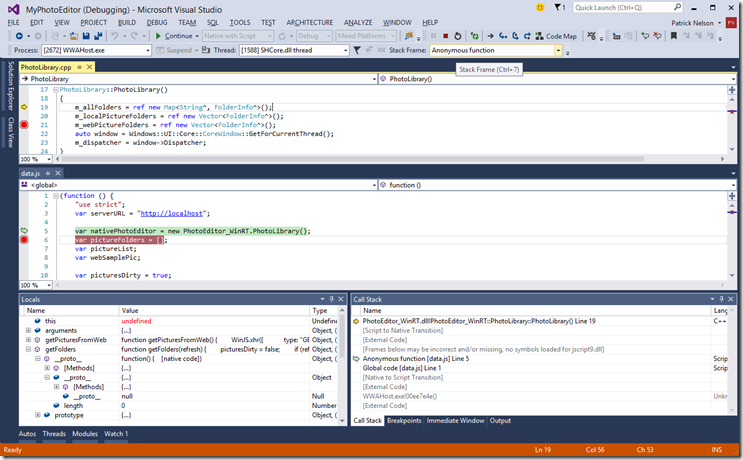
It is also possible to set breakpoints both in your native code files an in the JavaScript files. When you hit breakpoints, you’ll see call stacks with both Native code and JavaScript code. In addition, it’s possible to view local variables in the “Locals” window when inspecting a JavaScript frame. This works when stopping at a native or JavaScript breakpoint.
A Concrete Example
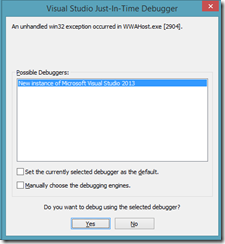
Say we are debugging an app that crashes on startup. If we debug it with Script Only, all we see is an unhandled exception in WWAHost and the Visual Studio Just-In-Time debugger:
If we debug with Native only, we get a bit more information. We see a divide by zero first chance exception in FolderInfo.h by looking at the Output window. To see why we are getting the divide by zero error, we can temporarily enable break on divide by zero exception via Debug -> Exceptions:
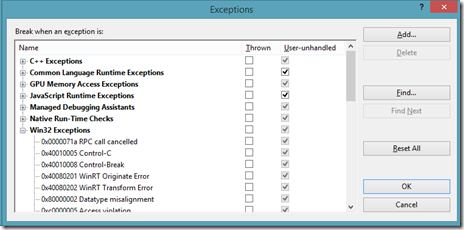
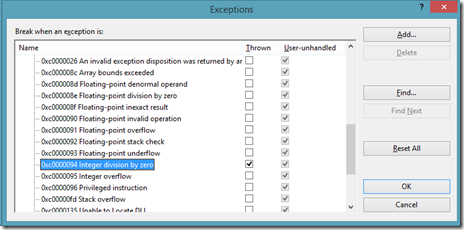
Running it again with break on first chance exceptions thrown, we see the divide by zero error is being caused because m_ImageList->Size is zero. Unfortunately, the deep call stack provides no clue as to how we got here except that we came from jscript9.dll:
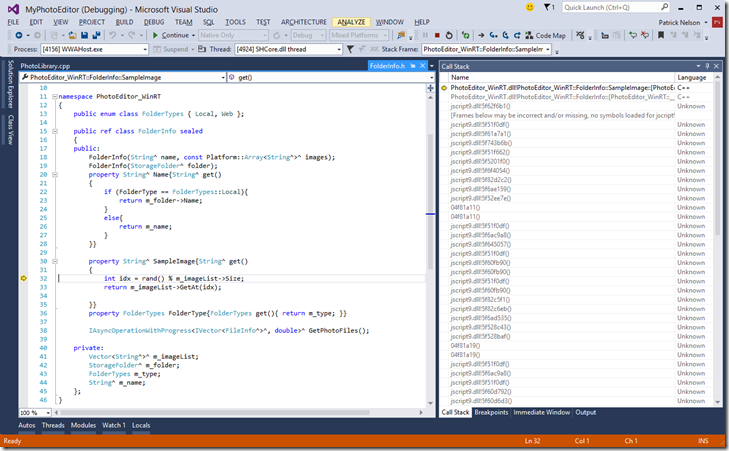
Using Native with Script we get more information. We can now see the JavaScript code on the call stack and see where we were in JavaScript code. We can see the call to folder.SampleImage and inspect the folder parameter via the Locals window. Notice we have the ability to inspect the native object even though we are currently looking at a JavaScript frame:
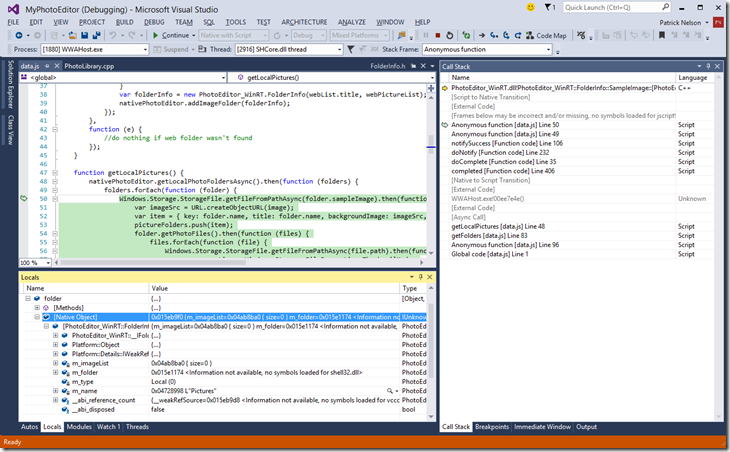
Here we see that the folder we are looking at is “Pictures” and there are no images in that folder. This is the cause of the divide be zero error. If we add a picture to the pictures folder the divide by zero exception goes away. We found and verified a possible fix.
By the way, now is a good time to turn off break on divide by zero exceptions so we don’t get extra noise during future debugging sessions.
In Closing
If you want to try this yourself, you can download the sample program I used to create this post.
We are actively looking for feedback on both this and other diagnostics features so please stop by our MSDN support forum and let us know what you think.

0 comments