In this blog post I’m going to talk about IntelliTrace’s default configuration and the ability to opt-in to capture method call information. If you haven’t done so already, check out the announcement of IntelliTrace in Visual Studio 2015 which gives you an overview of IntelliTrace and its improved UI. If you’re not already familiar with IntelliTrace, that post will help set the context.
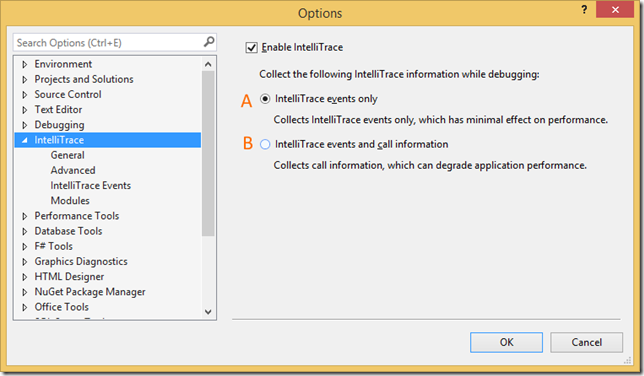
The following image shows you the IntelliTrace settings which you can access through Tools > Options > IntelliTrace:

- Option A – Default configuration: IntelliTrace collects events only, optimized for low overhead, Edit and Continue is unaffected
- Option B – Capture method call information: IntelliTrace records every single method call and captures some parameter information, Edit and Continue is disabled
Let’s go further into how these two options allow you to tailor the IntelliTrace experience to your debugging needs.
Option A – Default configuration
When you install Visual Studio, IntelliTrace is enabled by default and is set up to only collect events (option A above). This means that IntelliTrace will only record state information for moments in time it considers interesting rather than monitoring and recording every single method call. The diagram below shows you an example of how that works with a desktop app using ADO.NET:

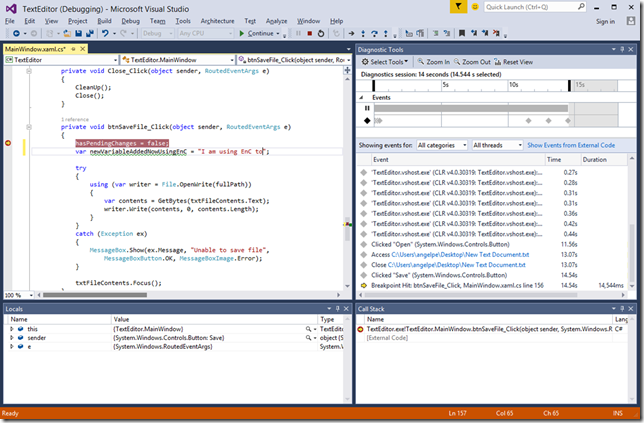
The default configuration is optimized for best debugging performance and supports EnC. As you can see in the screenshot below, I have the Diagnostic Tools window showing me the IntelliTrace events collected on the right and on the left I’m using EnC to change my code while still debugging (look for my cursor one line below the breakpoint):

For more information on the new IntelliTrace UI within the Diagnostic Tools window and how to consume the events collected by IntelliTrace check out the section titled “Live Debugging using IntelliTrace in Visual Studio 2015” from the announcement of IntelliTrace in Visual Studio 2015.
Option B – Opt-in to collect method call information
You have the choice to change IntelliTrace’s default configuration to collect events as well as every single method call that takes place (option B above). If the parameters are primitives (including strings), their values be captured as well. If the parameters are structs or complex types (i.e. instances of classes) only the properties that are primitive data types will be captured.
When enabled, a drop down appears above the filtering control in the Diagnostic Tools window. You can view the method call information that IntelliTrace has collected by changing the view to “Calls” using the drop-down:

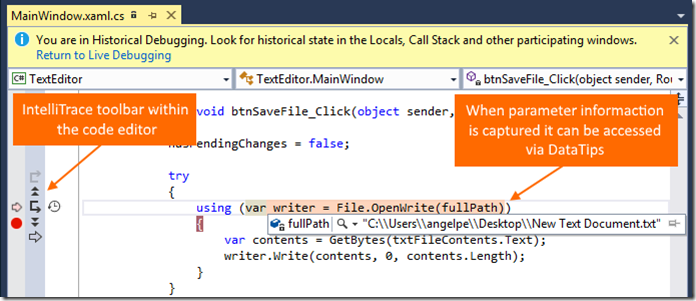
You can also navigate the history of the calls made using IntelliTrace toolbar that appears inside of the code editor, using DataTips to examine the value of the parameters:

Read more on how to consume the information shown in the Calls view as well as how to use the IntelliTrace toolbar that appears within the margin of the code editor.
Unfortunately, the API that IntelliTrace uses to collect the method call data doesn’t support Edit and Continue. This is the only case where using IntelliTrace affects your ability to use End and Continue, and hence you are unfortunately forced to pick which of the two productivity features you need most for that particular debugging session.
There are other cases where EnC doesn’t work regardless of IntelliTrace, but we are addressing that with continued improvements in EnC.
Wrapping up
We are always looking for feedback and comments, especially if there is a feature you find useful. You can leave general comments & questions at the end of this blog post or via Send-a-Smile, and submit feature requests to our IntelliTrace UserVoice. You can also send us a tweet.

0 comments