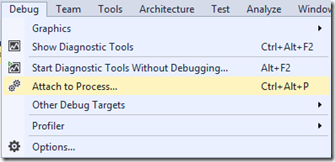
If you haven’t done so already, check out the announcement of IntelliTrace in Visual Studio Enterprise 2015 which gives you an overview of IntelliTrace and its UI. Since the release of Visual Studio Enterprise 2015 RC, IntelliTrace supports the ability to attach to running processes.

As soon as Visual Studio has successfully attached to the selected process the Diagnostic Tools window will show up. If it doesn’t, it may be because you previously closed it. You can bring back, even after you have attached, by clicking on the menu item Debug > Show Diagnostic Tools.
The only current limitation is that IntelliTrace cannot collect calls information when attaching to a running process. This means that IntelliTrace cannot collect the list of every method call made. If you attempt to attach with that option enabled nothing bad will happen, you simply won’t have access to the data.
We are always looking for feedback and comments for our features. You can leave general comments & questions at the end of this blog post or via Send-a-Smile, and submit feature requests to our IntelliTrace UserVoice. You can also send us a tweet or visit the MSDN Diagnostics forums.

0 comments